Market Snapshot: Tariff Tantrums TBD

While there is still uncertainty about the full scope of President-elect Donald Trump’s trade policy, tariffs will likely be a cornerstone to address the perceived unfairness of trade imbalances. The U.S. government has a long history with tariffs, with almost the entire federal budget funded by tariffs in the 70 years prior to the U.S. Civil War. For the years post-World War II, the effective tariff rates1 on U.S. imports have been below 10%. The proposed tariffs from Trump’s campaign trail2 were 10% universal tariffs and 60% China-specific tariffs. In addition, he recently announced plans to immediately impose a 25% tariff on imports from Canada and Mexico once he takes office.
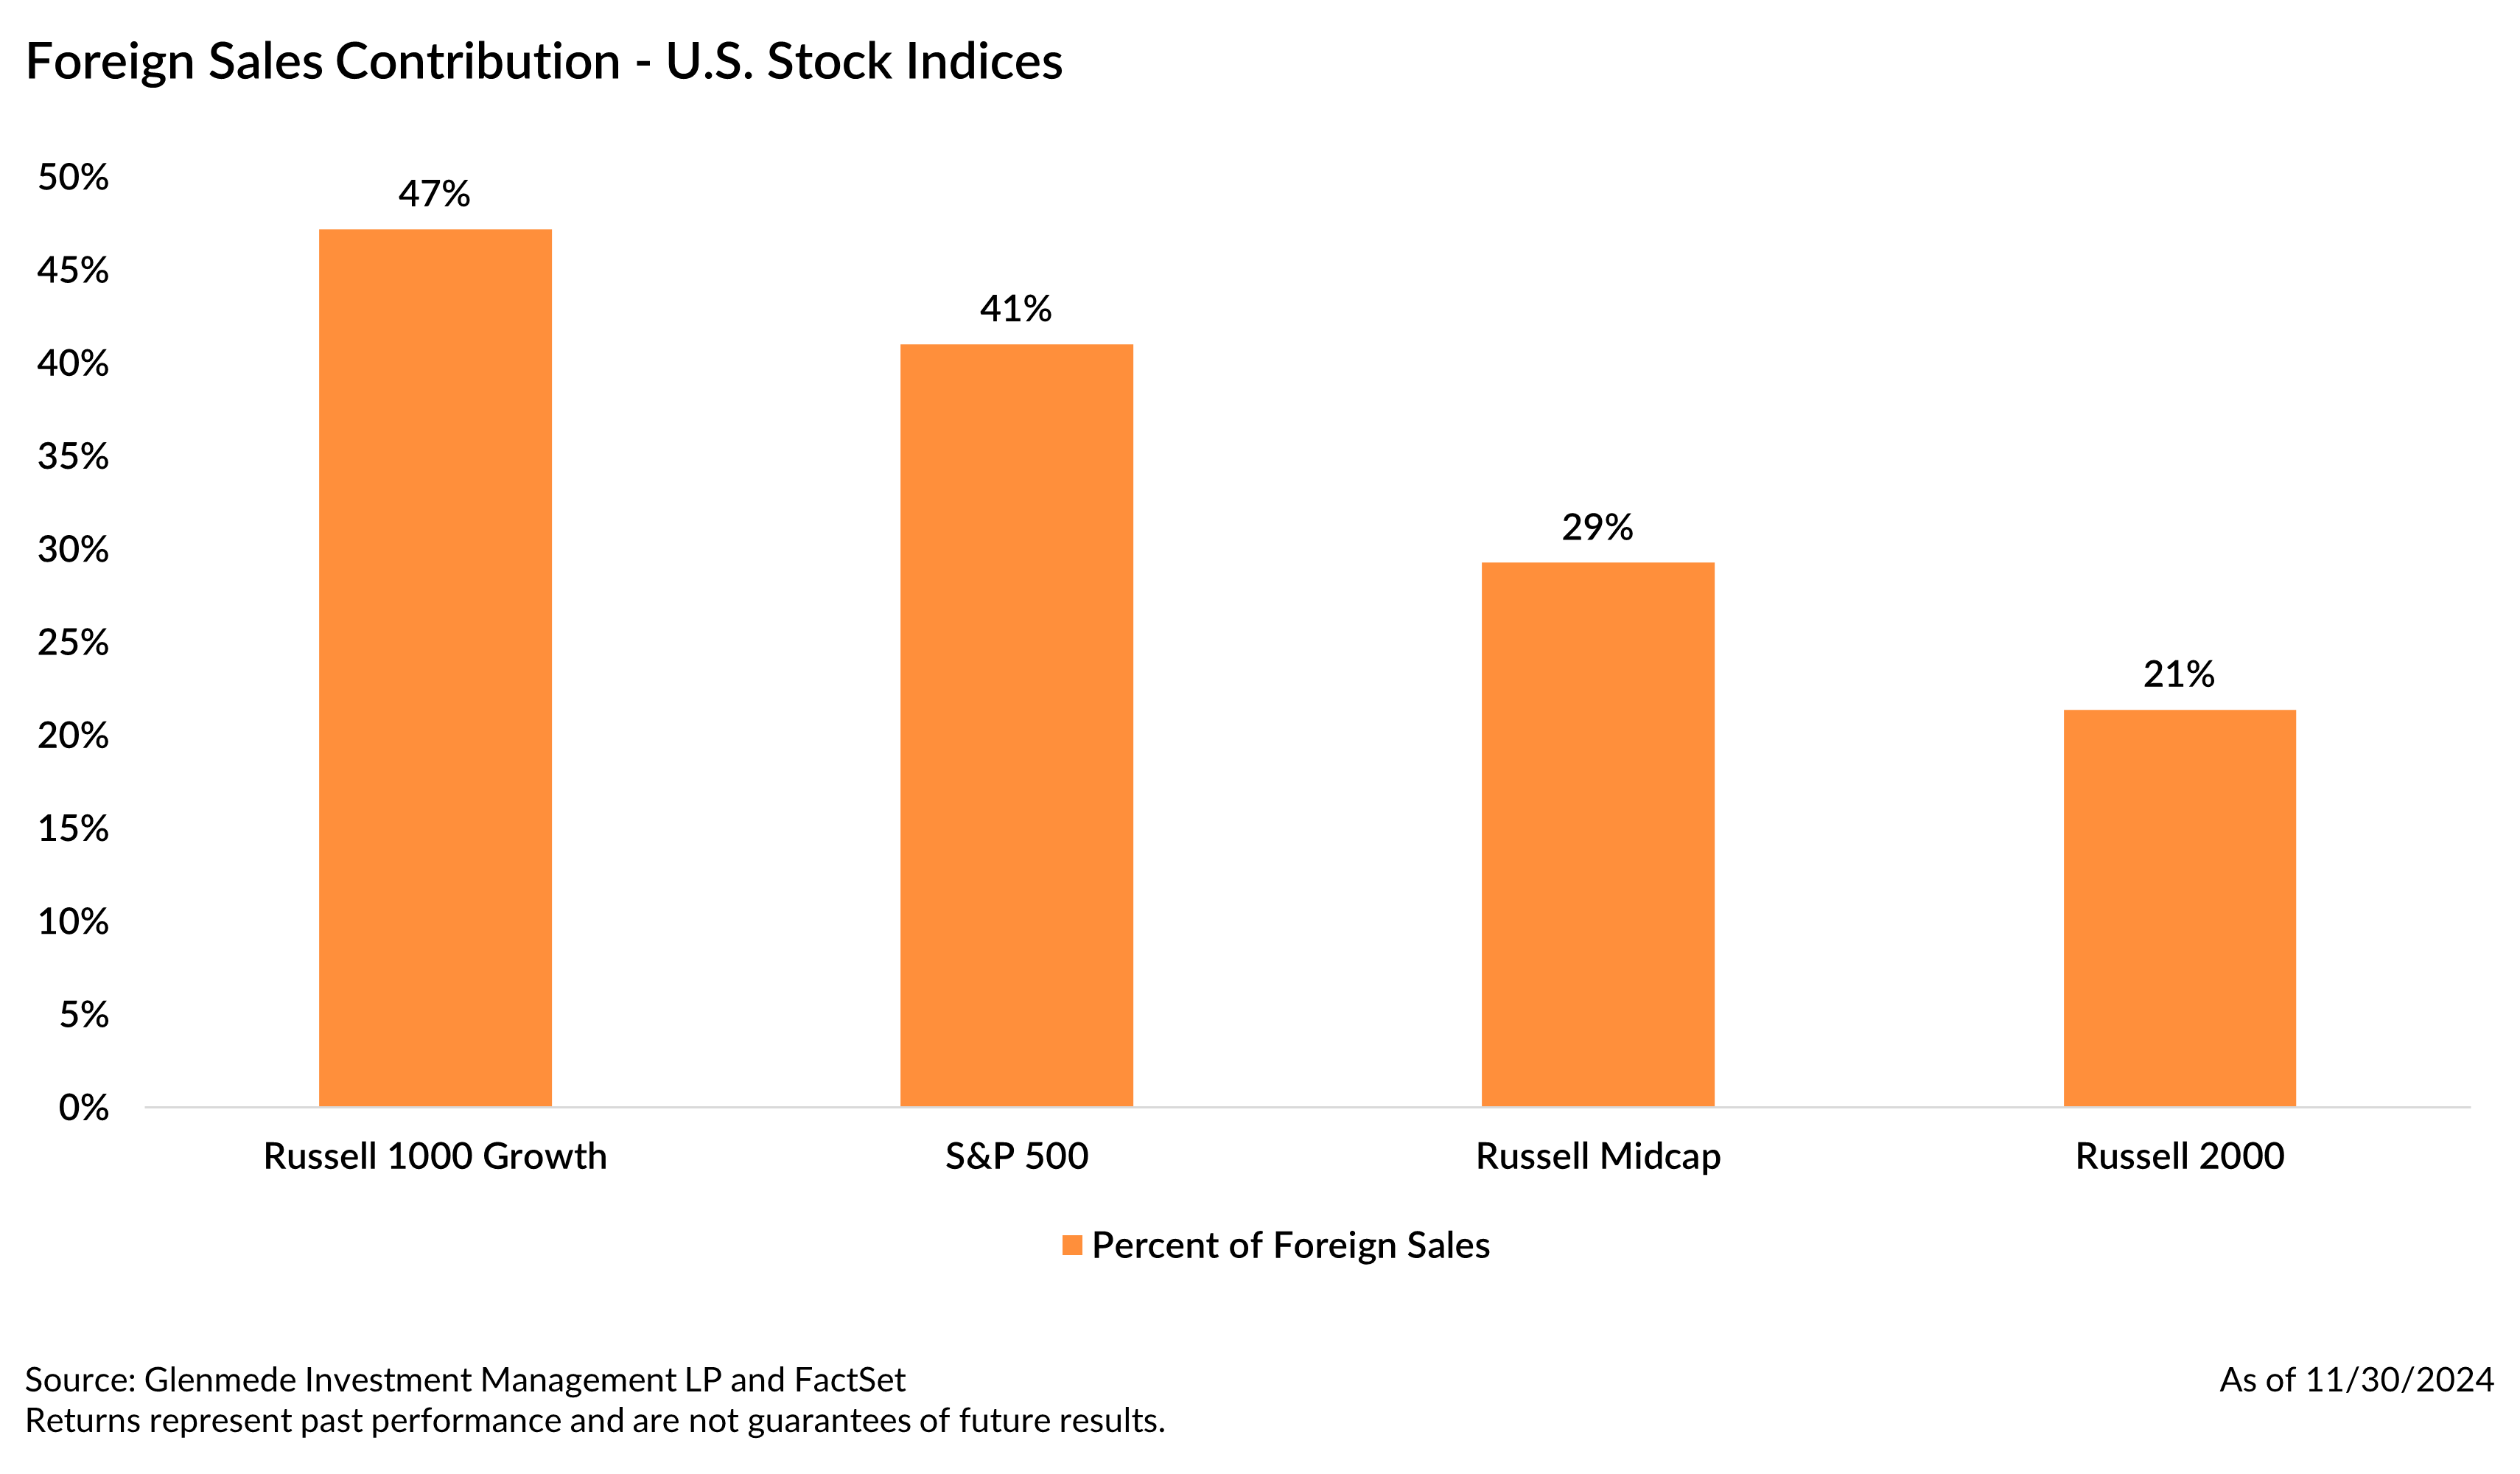
The impact of tariffs on stock prices will likely be driven by the perceived potential winners and losers in a trade war. The chart shows the high-level foreign sales component for U.S. stocks based on current index constituents. Given the foreign sales exposure for large cap growth stocks, a trade war would seemingly harm these companies more, while protectionist policies may be good for smaller, domestic producers.
The potential tariff headwinds for U.S. large growth companies versus U.S. small cap companies suggest large caps may experience more risk over the next year. From a valuation perspective, we believe that U.S. small caps potentially offer a more attractive valuation starting point3, which may experience smaller drawdowns should global risks escalate. With the potential headwinds of tariffs for U.S. large caps and the attractive relative valuations of U.S. small caps, we continue to believe that higher quality small caps offer an attractive risk/reward relative to passive large caps.
1 The effective tariff rates on U.S. imports over time includes nominal tariffs on final goods as well as on imported inputs used in production.
2 The “60% China Tariffs” increase all tariff levels on Chinese goods imports; “10% Universal Tariffs” increase tariffs on all goods imports to 10%.
3 The next 12-month (NTM) forward price-to-earnings (P/E) multiple of large cap (S&P 500) to small cap (S&P 600) is currently at a 32% premium compared to the median over the past 20 years of a 5.1% discount. We use the S&P 600 for a valuation perspective that reduces the potential valuation impact of negative earners in the Russell 2000. To remain consistent with various index methodologies, we compare the S&P 500 as a proxy for U.S. large cap to the S&P 600 as a proxy for U.S. small cap. For additional reading on this analysis, please see our Q1 2024 Quarterly Statement, Leaning into Equal Weight and Small Cap and our Q4 2023 Quarterly Statement, It’s a Small World After … 2023.
Views expressed include opinions of the portfolio managers as of November 15, 2024, based on the facts then available to them. All facts are gathered in good faith from public sources, but accuracy is not guaranteed. Nothing herein is intended as a recommendation of any security, sector or product. This is not intended as a solicitation for any service or product. All investment has risk, including risk of loss. Designed for professional and adviser use.