The Quarterly Statement Q3 2024: F.E.D. UP: FOMC, Election and Diversification – Three Risks Ahead
Market Review: Third Quarter 2024
 What We Know: Q3 2024 Recap
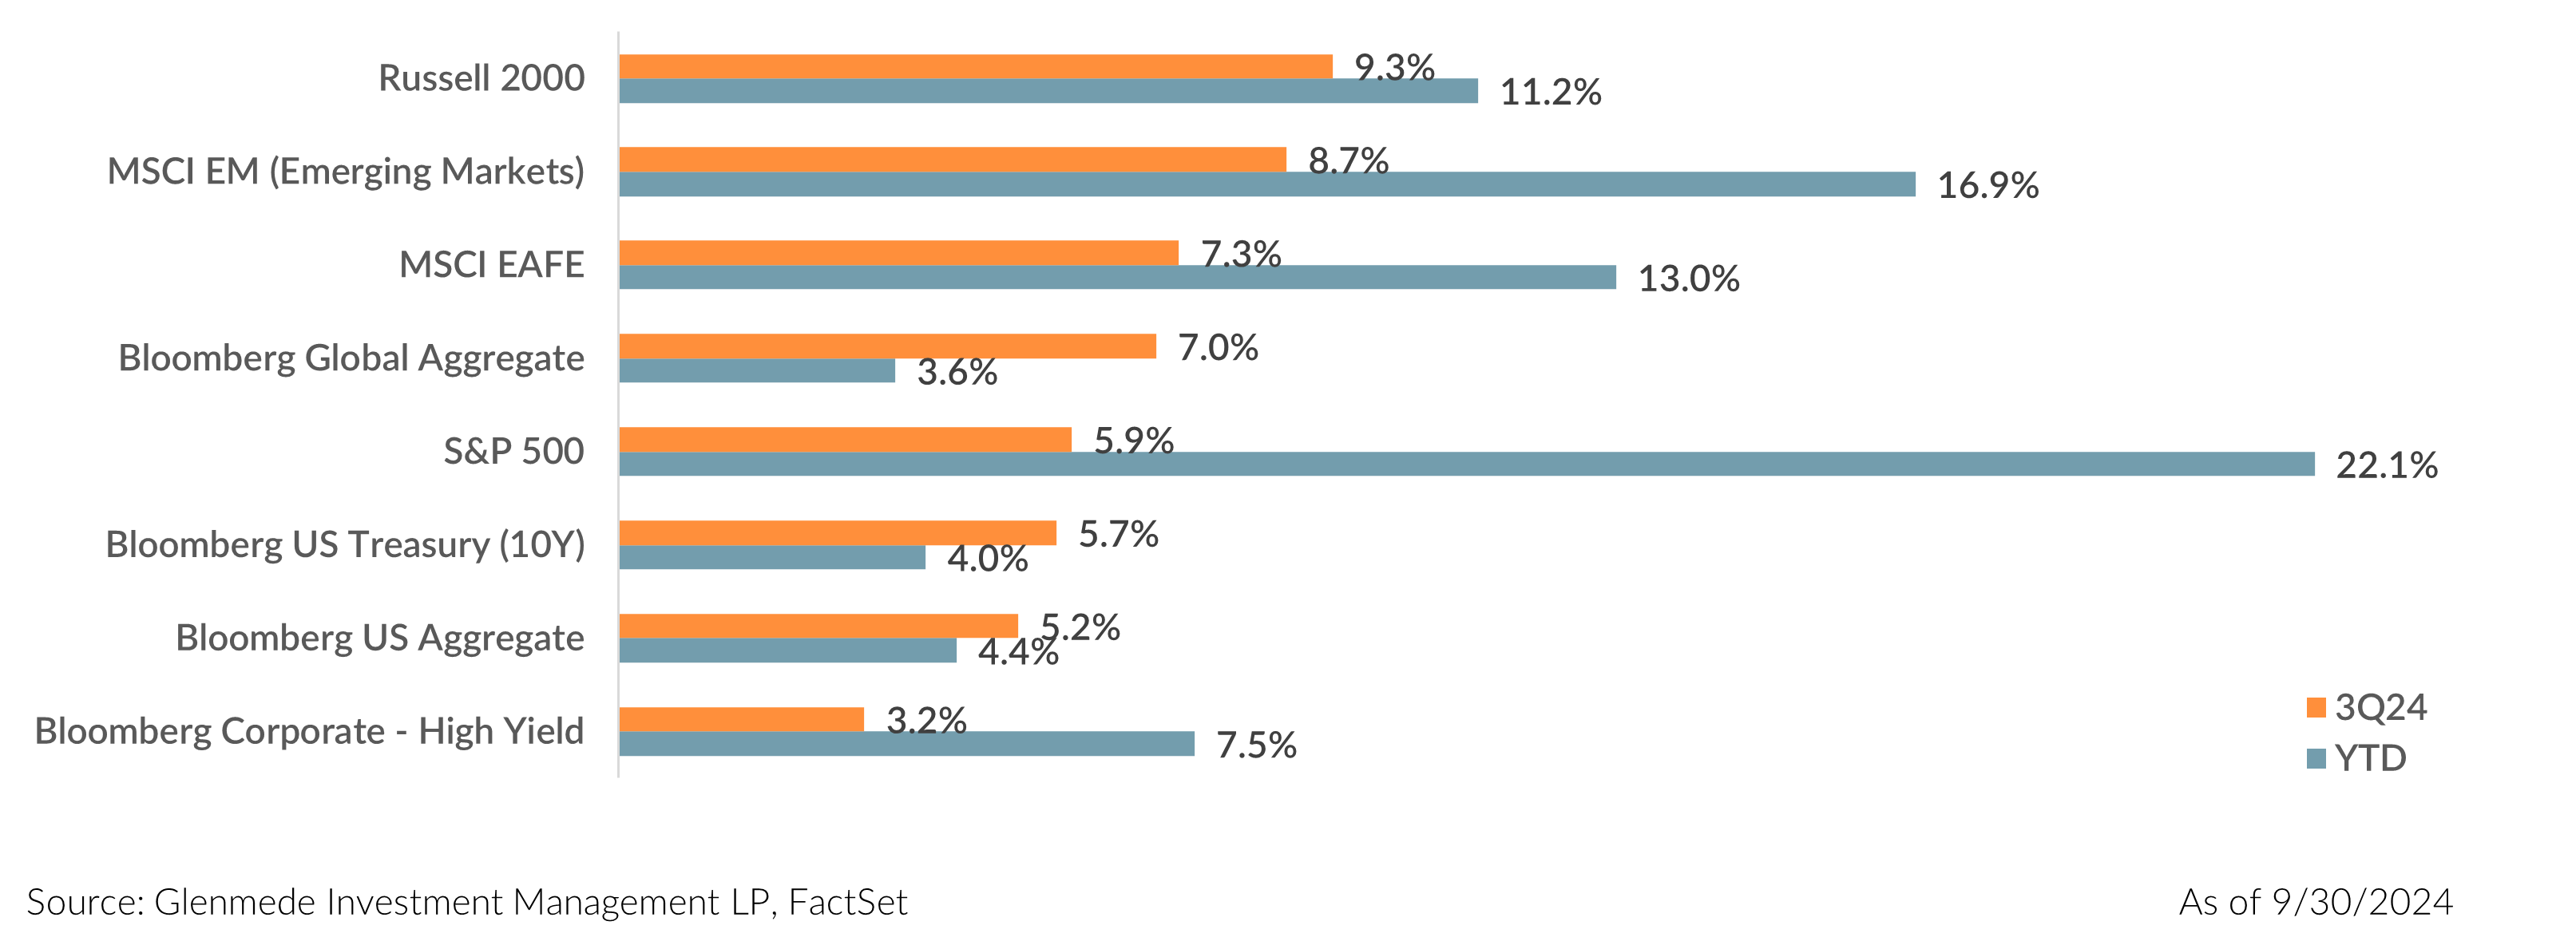
U.S. equity markets continued their bull-market rally with the S&P 500 Index finishing Q3 2024 with a 5.9% rally, a new all-time high closing price and a year-to-date rally of 22.1%. The rally broadened out to more than just the six mega cap growth stocks that have contributed almost 50% of the year-to-date rally (Apple Inc., Microsoft Corporation, Alphabet Inc., Amazon.com, Inc., NVIDIA Corporation, and Meta Platforms, Inc.)1, with U.S. value stocks, small cap and S&P 500 Equal Weight Index all having bright spots this quarter. The NASDAQ 100 finished higher this quarter, but without a continued strong performance of the six mega cap growth companies, the index saw its smallest quarterly return in a year, finishing Q3 2024 up 2.1% and bringing the year-to-date total return to 20.0%.
The S&P 500 Equal Weight Index outperformed the S&P 500 Market Cap Weight Index by 3.7% this quarter, the most since Q4 2022. The S&P 500 Equal Weight Index has trailed the Cap Weight Index by 6.9% year-to-date. With the broadening of the rally this quarter, value (Russell 1000 Value Index) outperformed growth (Russell 1000 Growth Index) for the first time since Q4 2022, with returns of 9.4% and 3.2%, respectively. While this quarter helped close the gap, since the start of 2023, value has underperformed growth by a cumulative 47.7% (22.6% average annualized return). This is the fifth greatest seven consecutive quarter underperformance of value to growth since the start of data in 19792, with the seven consecutive quarters ending Q3 2020 the greatest on record when value underperformed growth by 57.7%. While past performance is never a guarantee of future returns, in the previous four observations when growth outperformed value by more than 47.7% cumulative in the previous seven quarters, all instances saw value outperform growth over the next 12-months, with an average 12-month outperformance of value of 32.0%.3
Sector returns of the S&P 500 Index finished strong with all but Energy in the green (Energy declined 2.3%). In a shift of leadership, the more defensive and rate sensitive sectors took the lead with Utilities topping sector returns followed by Real Estate (19.4% and 17.2%, respectively). The strong performance of Utilities knocked the Information Technology sector off the year-to-date top performer, returning 30.6% versus Information Technology returns of 1.6% this quarter and 30.3% year-to-date. All sectors have experienced positive returns year-to-date, with Energy lagging with a year-to-date return of 8.4%.
Small cap outperformed large cap this quarter by its largest margin since Q1 2021 (Russell 2000 rallied 9.3% versus S&P 500 rally of 5.9%). Year-to-date, small cap has rallied half as much as large caps (11.2% for Russell 2000 versus 22.1% for S&P 500). As discussed previously4, we continue to believe there is an attractive risk/reward set-up for higher quality small caps, particularly relative to passive large caps.
International markets experienced strong returns this quarter with Emerging Markets (MSCI Emerging Markets Index) returning 8.7% and Developed International (MSCI EAFE Index) 7.3%. International markets continue to lag the domestic markets year-to-date (MSCI Emerging Markets Index 16.9%, MSCI EAFE Index 13.0% versus S&P 500 Index 22.1%).
The Federal Reserve kicked off a new easing cycle with a 50 basis point cut at the September meeting. Market expectations continue to price in more cuts through year-end and into 2025. The U.S. Treasury curve steepened notably, with the U.S. Treasury 2Y-10Y yield spread flipping from negative to positive in September. This spread is a much-watched recessionary indicator and has been inverted since mid-2022 but finished Q3 2024 +15 basis points, a far cry from the more than 100 basis point inversion experienced in Q3 2023.
What We Debate: A Practitioner’s Perspective – Three Risks Ahead
“TO EXPECT THE UNEXPECTED SHOWS A THOROUGHLY MODERN INTELLECT.”
– Oscar Wilde
As we head into year end and look into 2025, we consider three risks that could cause volatility or unexpected results relative to consensus. We first consider the recent decision by the Federal Reserve to cut rates by 50 basis points in September and why this does not have to be the start of a string of cuts. We then calculate the volatility around the 2024 U.S. Elections in November and potential short-term market moves. Lastly, we revisit the lack of diversification in the broader large cap passive indices and the unexpected returns investors could experience should the six mega cap giants falter.
1. FOMC: Could the Unexpected be Less Cuts?
This quarter saw two key data points relative to the Federal Reserve’s dual mandate – stable prices (inflation) and maximum employment – which led to the Federal Reserve cutting rates by 50 basis points at the September meeting, more than the 25 basis points many economists had anticipated. Inflation showed signs of easing following the Consumer Price Index falling to a 2.5% annual growth rate in August, below the 3.4% rate to start the year and well off the cycle high of 9.1% in mid-2022. The July job’s report created some concerns that the Federal Reserve was behind the curve with rate cuts, although those concerns were eased somewhat with August’s job’s report. Ultimately, the concerns around employment were the driving factor of the decision based on messaging from the Summary of Economic Projections that said potential weakness in the labor market was more of a concern at this point than inflation. The updated dot plot called for an additional 50 basis points of rate cuts through year-end and another full percentage point of rate cuts in 2025.
Market expectations predict that the Federal Reserve needs to cut rates aggressively to get back to “neutral”. While economic data has had some variance lately, particularly when comparing the job’s reports of July, August and September, the broader picture suggests the economy may be humming along just fine. Could the Federal Reserve be entering a phase where they need to keep rates higher for longer to avoid rekindling inflation concerns, but there may not be the political will for such actions?
Highlighting an observation Glenmede Investment Management’s Quantitative Portfolio Manager Alex Atanasiu discussed in Why the Cyclicality of R-star Keeps Our Bands of Uncertainty Wide, what does the neutral rate of interest (r-star5) suggest about future cuts? We believe analyzing the neutral rate of interest (r-star) by dividing the history into cycle regimes of approximately 20 years shows a stronger statistical relationship to real interest rates than using one homogenous period, as shown in Exhibit 1.
The chart compares the COVID-adjusted Holston, Laubach, Williams (HLW) model from 1960 through Q3 2024 to the real interest rate over this same period, with historical recessions noted in gray. The historical correlation of the HLW model to real interest rates is 0.54, suggesting a reasonable long-term relationship, yet with a significant amount of unexplained movement. If we divide the periods into three regimes (1961-1980, 1980-2000 and post-2000), the correlation increases appreciably to 0.71. This higher correlation could suggest that interest rate policy since 1960 may best be described as regime dependent.
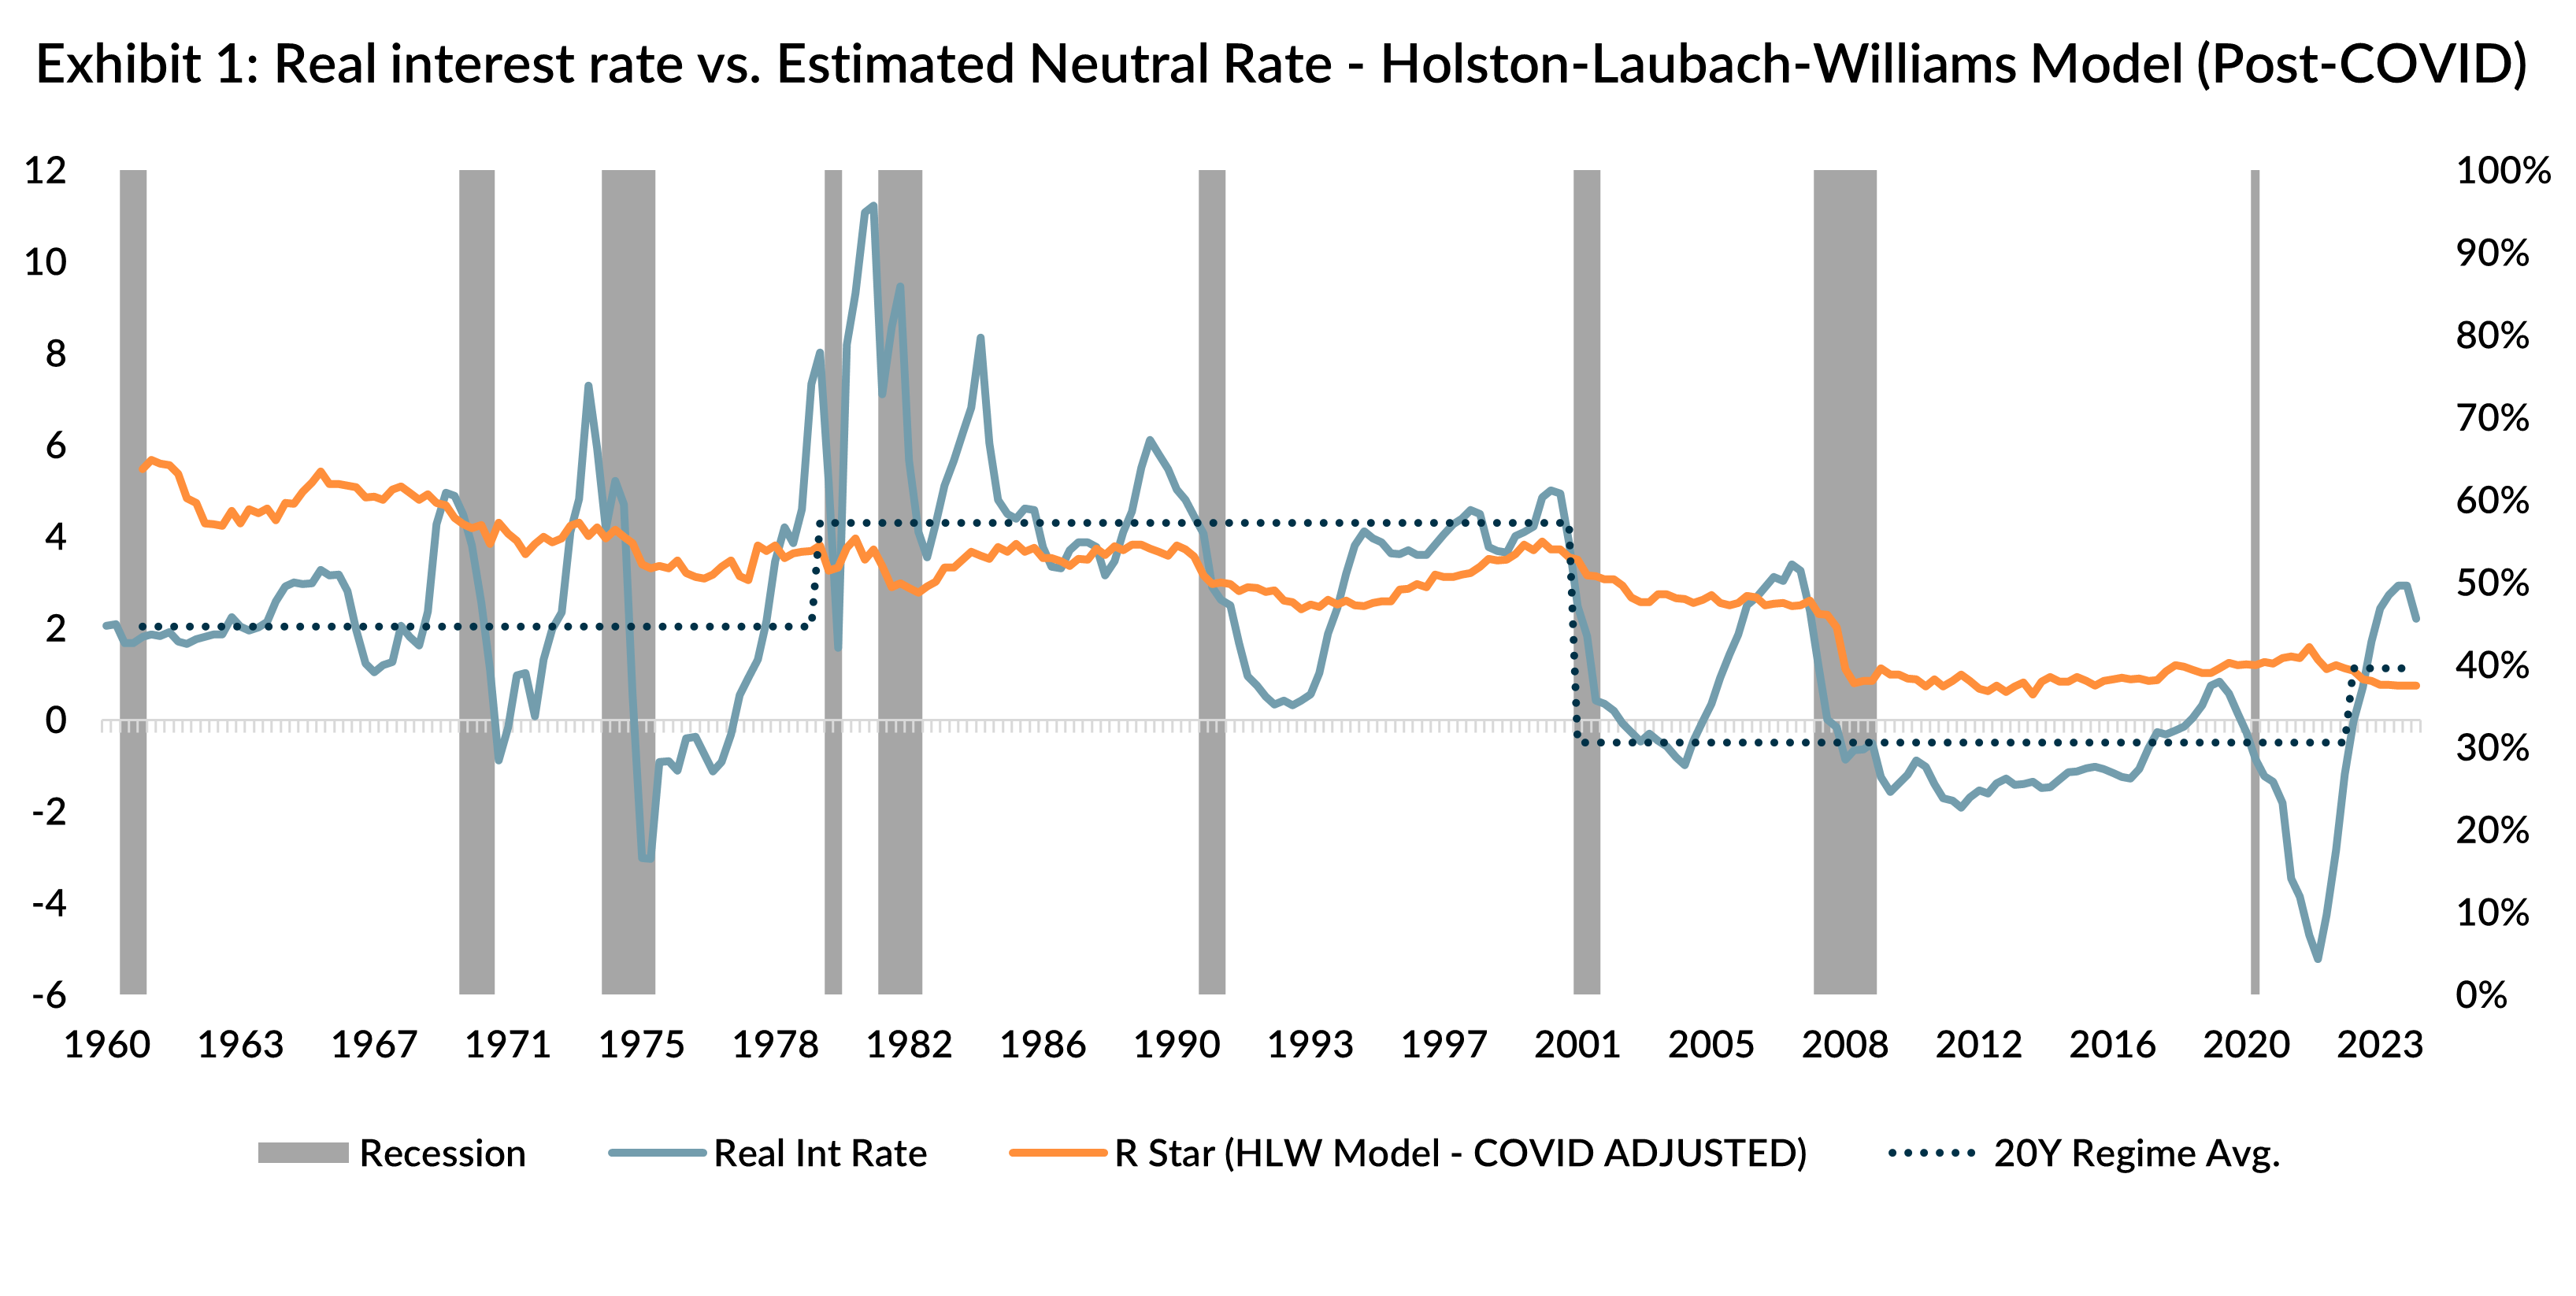
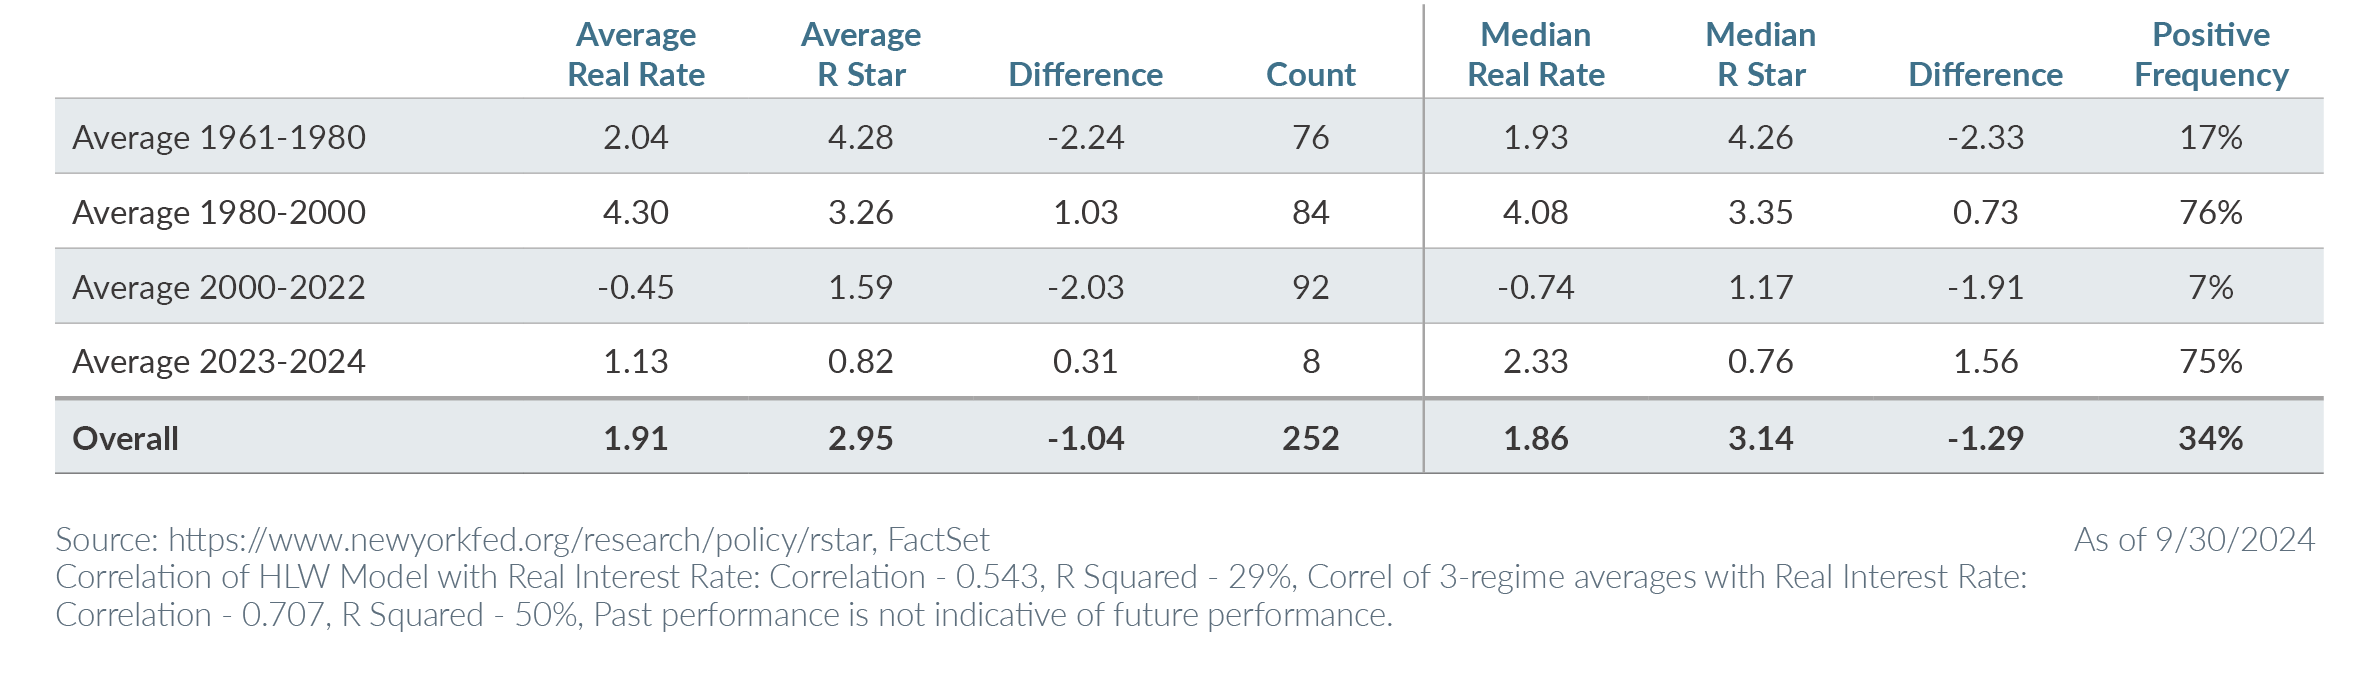 As noted in the table, these three regimes are approximately 20-year cycles, alternating between periods of the neutral rate above real interest rates (1961-1980 and post-2000) or below (1980-2000). In the 1960’s and 1970’s, the Fed Funds Rate was consistently below estimates of HLW modeled neutral rates. For those 20 years, on average, rates were 2.24% below neutral, and “easy” 83% of the time. In the early 1980’s, as inflation became the concern, the Federal Reserve raised rates aggressively, keeping rates on average 1.03% above neutral, and “tight” 76% of the time through 2000. From 2000 to 2022, the Federal Reserve maintained an easy policy that mirrored the 1960’s, with rates staying 2.03% below neutral on average, and “easy” 93% of the time. After another inflation concern, the Federal Reserve began raising rates aggressively above neutral in 2022, mirroring the 1980’s. Real rates in Q2 2024 were the “tightest” markets have experienced since 1989 according to the model, and rates have been “tight” 75% of the time over the past two years.
Our intention in this analysis is to discuss the unexpected. We believe market expectations are too high for a smooth transition to lower rates over the next 18 months and the probability of more volatility and more surprises is higher than market consensus. We need to consider the unexpected possibility where the real interest rate can consistently hover above the neutral rate for a prolonged period without triggering a recession — as it did in the 1980s and 1990s. If we are in this type of regime, it is possible that the expectation of smooth and methodical rate cuts by the Federal Reserve will likely not be the path forward. If the expectation of rate cuts does not materialize, the yield curve will likely adjust to a new normal with higher long-term interest rates and the more expensive areas of the equity market could see increased volatility. We believe investors with significant exposure to high growth-focused areas of the equity market need to be aware of this potential surprise and may consider diversifying away some of the risk to more reasonable valuation-focused areas of the market.
2. Election: What is the Unexpected?
The political landscape shifted this quarter with Vice President Kamala Harris becoming the Democratic nominee, replacing President Joe Biden at the top of the ticket for the 2024 U.S. Election. After an initial bump in the polls for Harris, the election appears to be a toss-up6 between former President Donald Trump and Harris. Interestingly, the market implied “election volatility” has remained consistent throughout the quarter, regardless of polling data. As shown in Exhibit 2, the closing CBOE Volatility Index7 (VIX) futures curves at each month end8 this quarter displays a clear increase in expected volatility around the election and a normalization process post-election9.
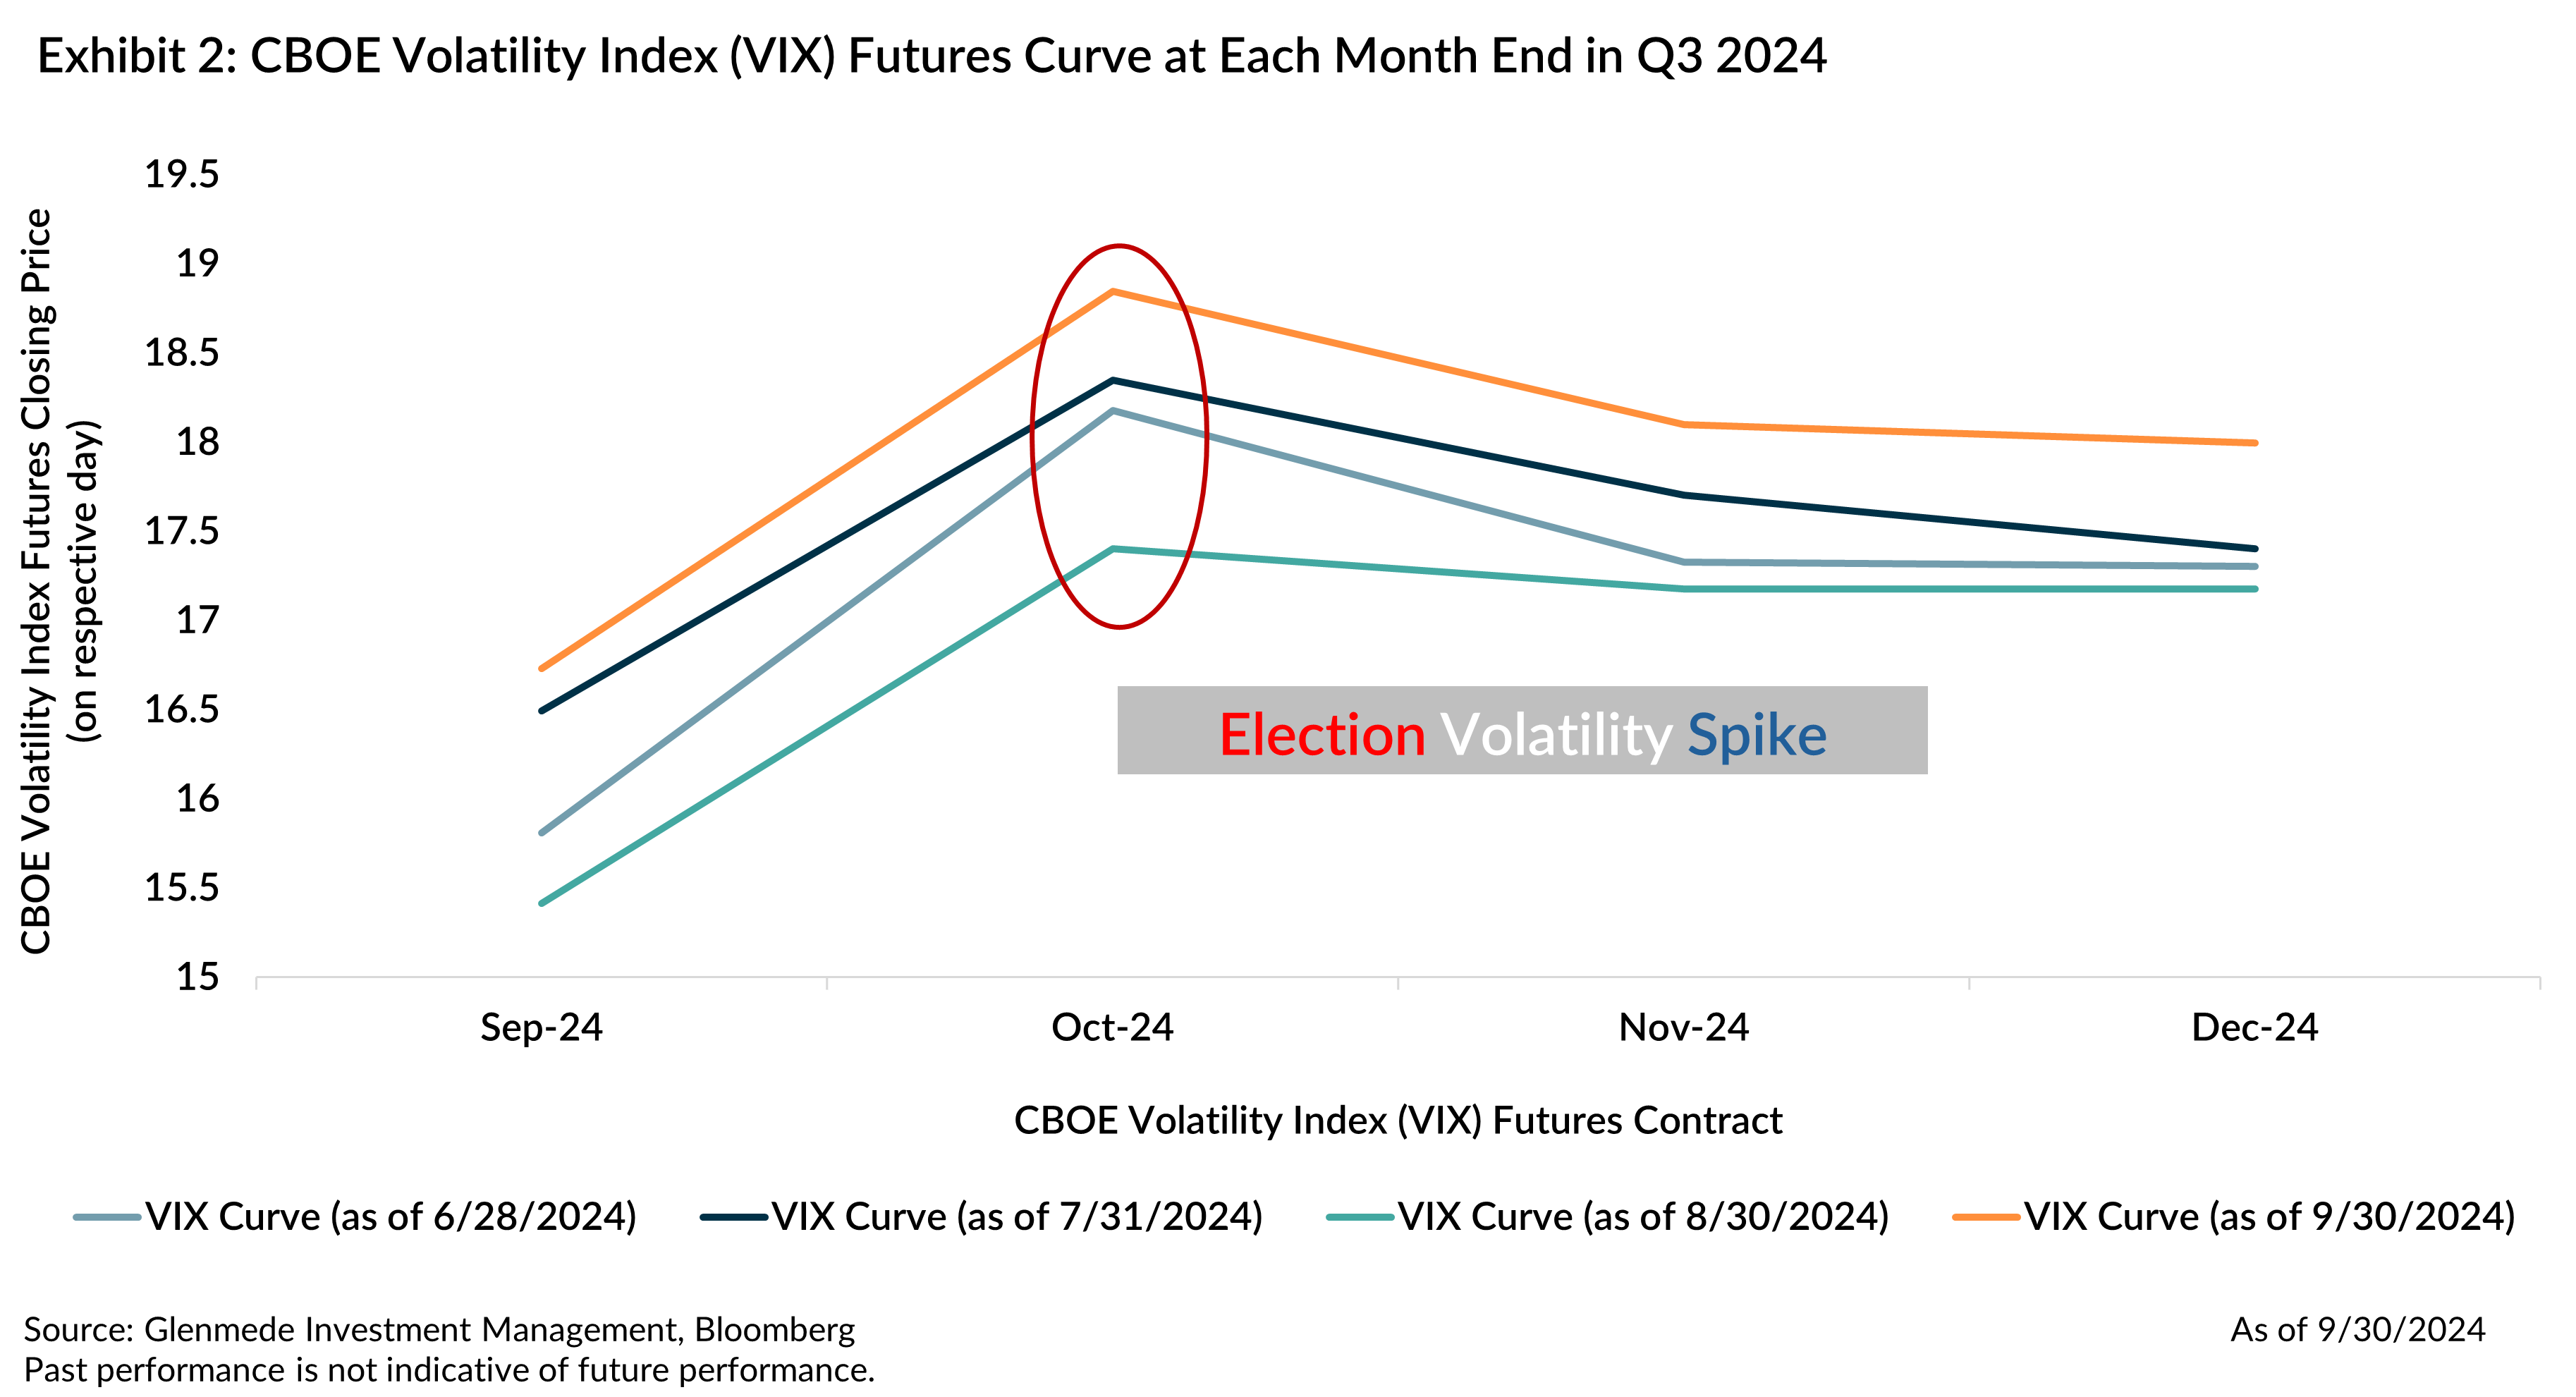 The increase from the September value10 for each month end relative to the October futures value was about 2 points across all timeframes. A back-of-the-envelope11 implied 1-standard deviation move for the S&P 500 Index on the day after the election is approximately 3%. Assuming a normal distribution, this would suggest a 5% probability that the S&P 500 could experience a 6% daily move. While this type of move is certainly not the expected outcome, it is within the range of possible moves for the day. The more important takeaway from the chart is the normalization process post-election. This suggests headlines might surprise but eventually markets should adjust and volatility should normalize.
While the headlines of who wins the presidency is sure to cause some emotional volatility, the more notable longer-term volatility is dependent on whether either party has a clean sweep, particularly a filibuster-proof majority in the Senate. Markets had stronger performance historically in periods without one controlling party, which was likely a result of more checks and balances rather than a domination of one party’s agenda. Comparing S&P 500 Index annual returns12 from 1872 through 2022 for the various election outcomes, a strong sweep saw annualized returns of 1.5% compared to a weak sweep of 9.3% and a divided government of 7.3%.
The Republicans are favorites to win the Senate13, but current polls suggest a very low probability of either party achieving a filibuster-proof majority in the Senate. The Republicans are small favorites to win the House14, although other models consider this more of a toss-up. The combination of these implied probabilities suggests a low probability of a single party having a strong majority for the next two years – a very unexpected outcome.
3. Diversification: What if Price Appreciation of the Tech Heavy Weight Companies Unexpectedly Collectively Stalls?
This report is not the first, nor is it likely to be the last, that we discuss the unprecedented concentration in U.S. large cap passive indices15. The exposure to a concentrated large cap passive strategy offers favorable returns when the top weights are outperforming the average stock of the index, but the risk is the diversification benefits potentially considered when the index was purchased may no longer be an appropriate assumption. With signs of broader market participation occurring and concerns the Federal Reserve may have less ability to cut rates than market expectations imply, what if the top heavy constituents unexpectedly become performance laggards versus leaders?
Exhibit 3 shows the effective number of names using the Herfindahl-Hirschman Index (HHI)16 for four of the passive U.S. large cap indices over the past 20 years (S&P 500 Index, Russell 1000 Index, NASDAQ 100 Index and Russell 10000 Growth Index). The historically diversified broad-based indices of the S&P 500 and the Russell 1000 are near their lowest diversification on record (S&P 500 Index is 51 versus 20-year average of 115 and Russell 1000 Index is 62 versus 20-year average of 145). The Russell 1000 Growth Index has some of the most extreme concentration – or lack of diversification – with the effective number of names just 19, versus the 20-year average of 77. Interestingly, the Russell 1000 Growth Index remains less diversified than the NASDAQ 100 Index, an index of which investor expectations are for more concentrated exposure to technology and growth companies from a smaller number of constituents. The NASDAQ 100 had a special rebalance17 last year which capped some of the exposure to the mega cap tech names to adjust for some of the concentration resulting in a current HHI of 27 compared to the 20-year average of 23.
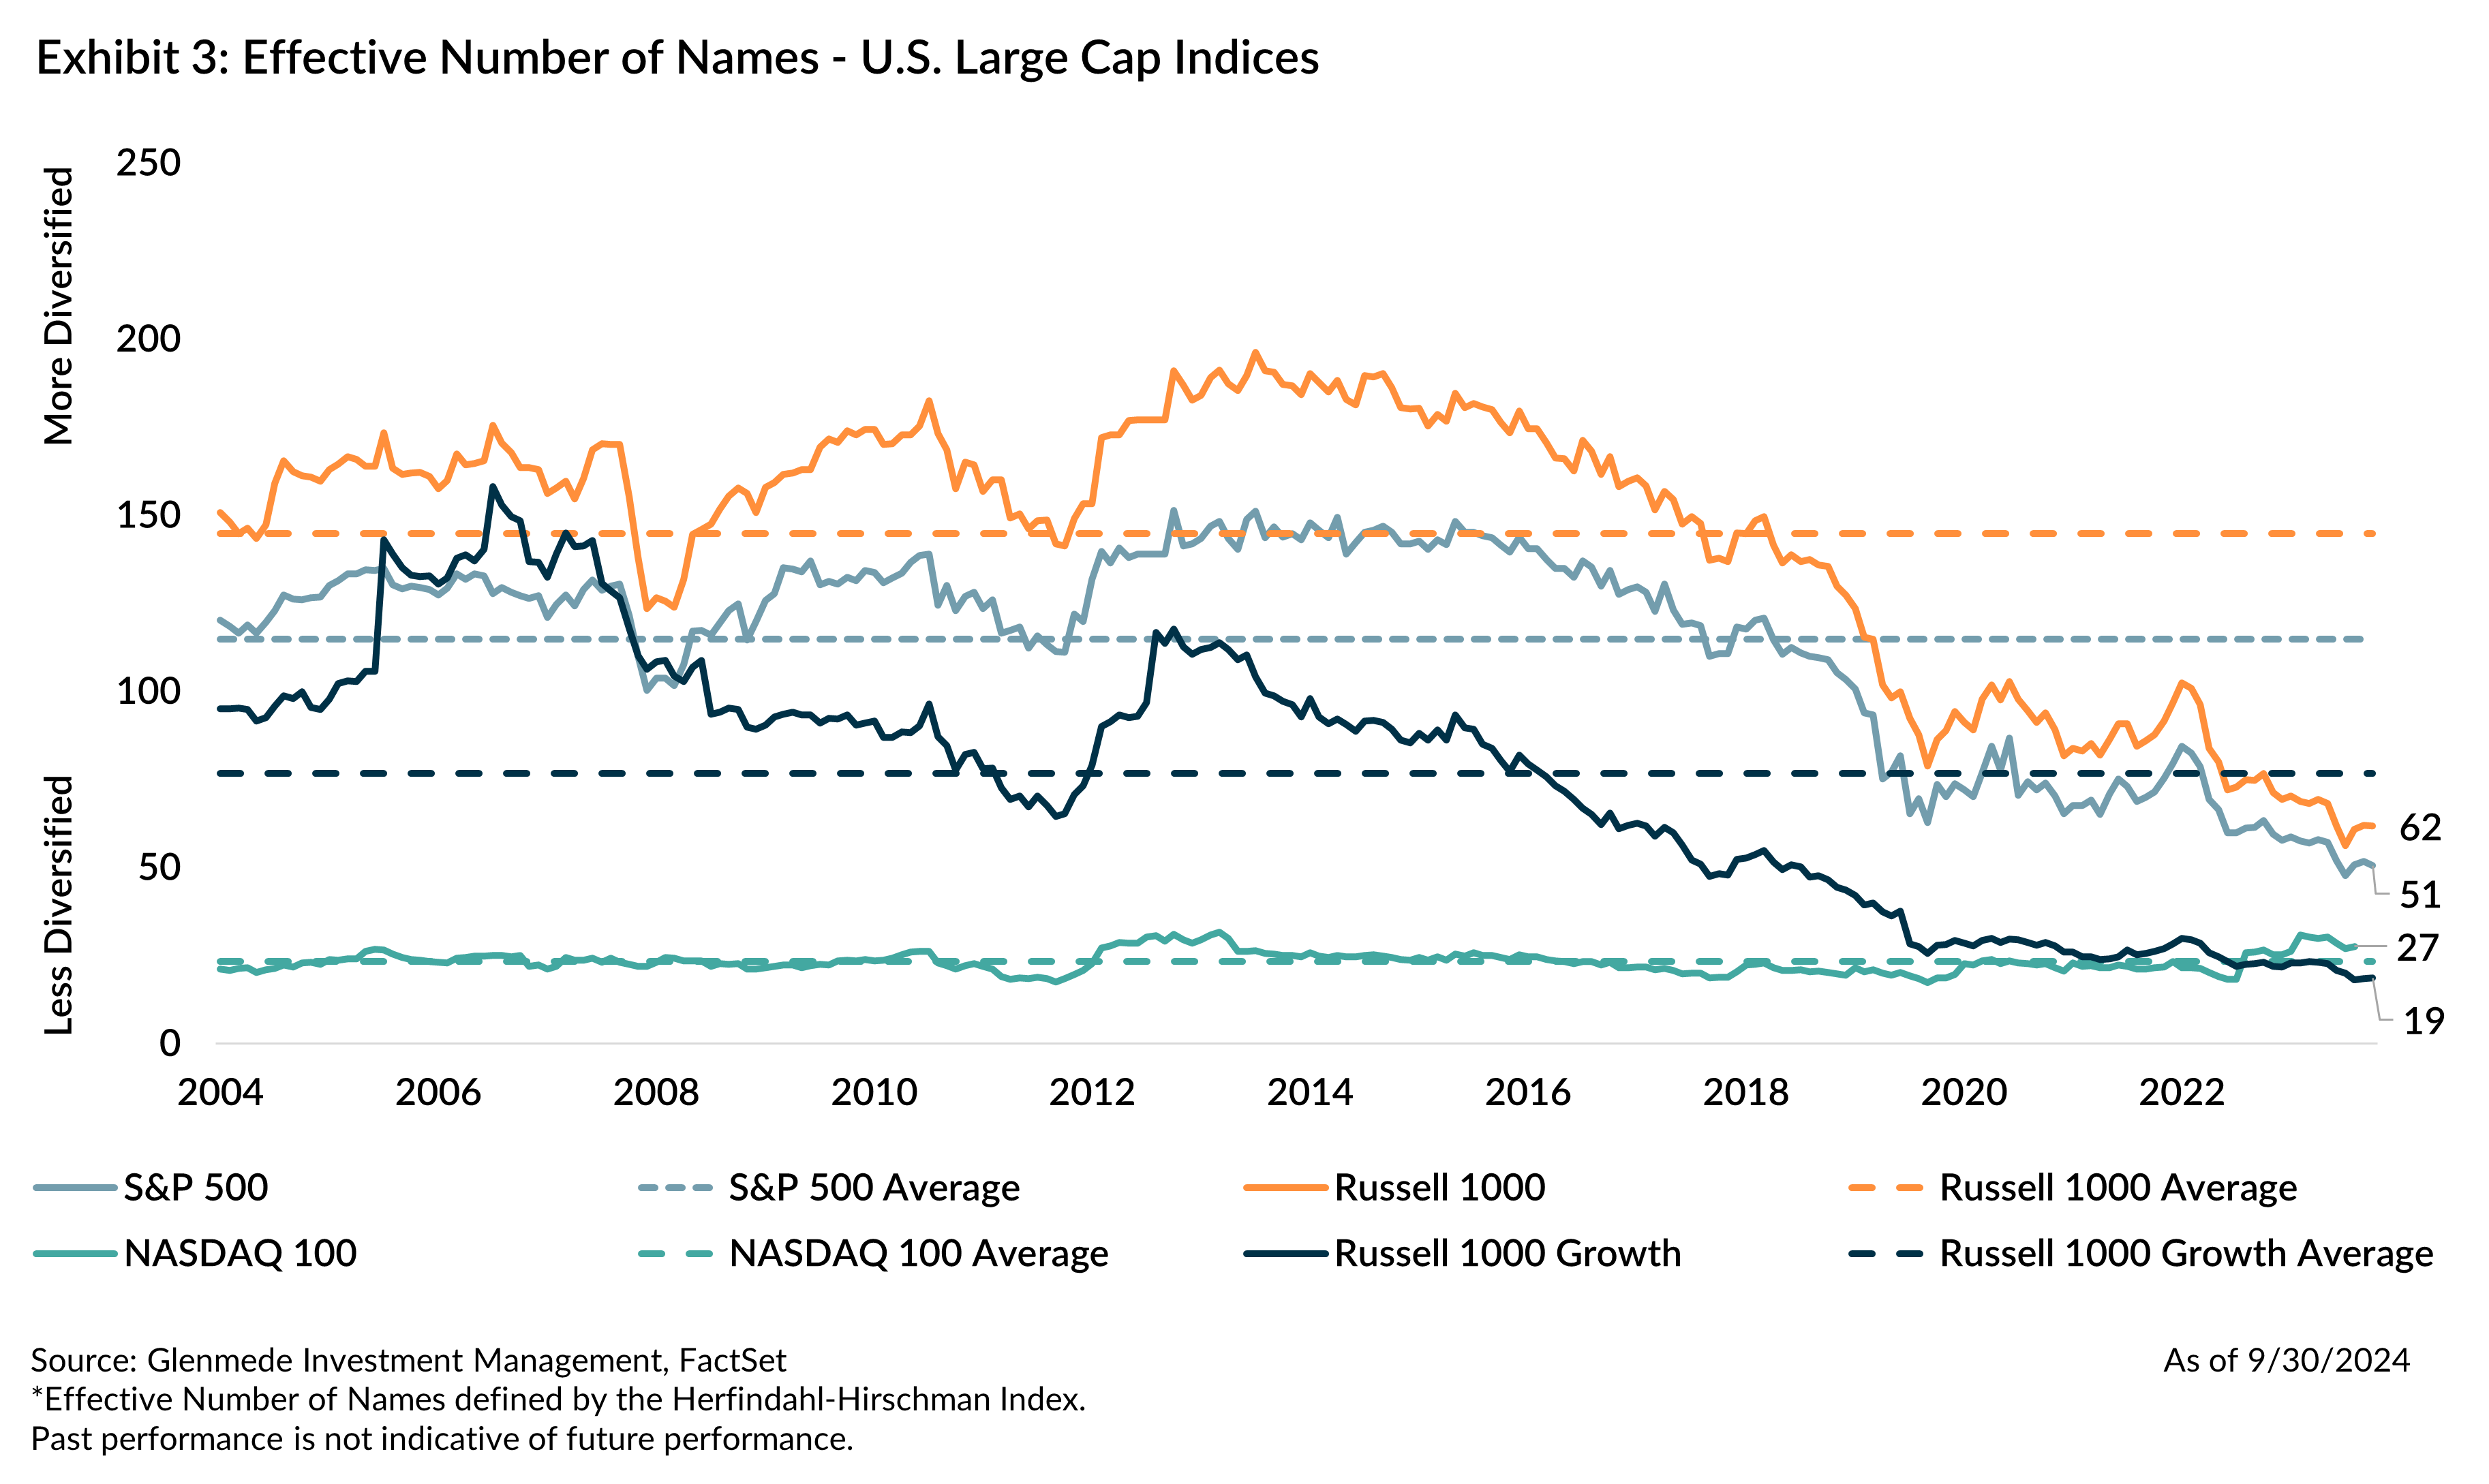 While we are discussing the concept of expect the unexpected, we acknowledge that the unexpected could be continued strong outperformance of the heavily concentrated names, and any reallocation to more diversified strategies could be a headwind to returns. Our reasoning is not that the unexpected has to negatively impact the most concentrated stocks but that we believe diversification is a strong tenet to robust portfolio construction over full market cycles. As these passive indices become less diversified, the benefits of diversification decline. For those who believe that a broad-based passive index like the S&P 500 is supposed to offer a well-diversified portfolio of stocks across various sectors and industries, does the current effective number of stocks offer the diversification characteristics desired?
 July 17, 2024
The Quarterly Statement Q2 2024: Seven Magnificent Charts of Concerning Historic Concentration in U.S. Large Cap Passive Indices
Market Review Second Quarter 2024 What We Know: Q2 2024 Recap U.S. equity markets continued their bull-market rally with the S&P 500 Index reaching new market highs …
 April 18, 2024
The Quarterly Statement Q1 2024: Leaning Into Equal Weight and Small Cap
Market Review First Quarter 2024 What We Know: Q1 2024 Recap The equity bull market continued the rally in Q1 2024 as stronger economic data and corporate …
1 The 6 mega cap growth companies (Apple Inc., Microsoft Corporation, Alphabet Inc., Amazon.com, Inc., NVIDIA Corporation, and Meta Platforms, Inc.) attributed 46% of the year-to-date return for the S&P 500 Index and 67% for the Russell 1000 Growth Index. In contrast, these same 6 companies contributed only 4% to the S&P 500 Equal Weight Index.
2 The top four periods when the previous 7 quarters had growth outperformed value were Q3 2020 (57.7% cumulative growth outperformance), Q2 2000 (56.0% cumulative growth outperformance), Q1 2000 (53.1% cumulative growth outperformance) and Q4 1999 (49.2% cumulative growth outperformance).
3 The top four periods when the previous 7 quarters had growth outperformed value saw value outperform growth over the next 12-months Q3 2020 (7.7% value outperformance), Q2 2000 (46.9% value outperformance), Q1 2000 (43.4% value outperformance) and Q4 1999 (29.8% value outperformance).
4 For more reading our on perspective of higher quality small cap, please see the following Quarterly Statements – Q1 2024, Q4 2023 and Q3 2023
5 The neutral rate of interest (r-star) is the estimated short-term interest rate that is neither contractionary nor expansionary for the economy. The value is an estimate with the Holston, Laubach, Williams (HLW) calculation being an often-cited value. Given the Federal Reserve’s ability to control short-term interest rates with the fed funds rate, a target rate above or below the neutral rate of interest is thought to be a lever to cool a hot economy or stimulate a slower economy. This suggests the r-star can serve as a guidepost for monetary policy, with many strategists currently calling for a recession on the back of “lagging effects” of having real rates rise above neutral.
6 RealClearPolitics betting average to win the Presidential election for former President Donald Trump at 50.1% and Vice President Kamala Harris at 48.6%, as of October 6, 2024.
7 According to the cboe.com, the CBOE Volatility Index (VIX) is “a financial benchmark designed to be an up-to-the-minute market estimate of expected volatility of the S&P 500 Index, and is calculated by using the midpoint of real-time S&P 500 Index (SPX) option bid/ask quotes. More specifically, the VIX Index is intended to provide an instantaneous measure of how much the market thinks the S&P 500 Index will fluctuate in the 30 days from the time of each tick of the VIX Index.”
8 The VIX future is a representation of market expectations for volatility of the S&P 500 for the 30 days forward from expiration (ex. VIX October future is the market’s expectations for S&P 500 volatility the 30-days after October expiration (10/16/2024)). VIX futures curve as of the close on 6/28/2024, 7/312024, 8/30/2024, and 9/30/2024.
9 For additional information, please see our Market Snapshot 2024 Election Volatility Elevated.
10 The September futures price was used for the VIX futures curve as of the close on 6/28/2024, 7/312024, 8/30/2024. The spot price was used for a September value for the 9/30/2024 curve.
11 If we assume all days with the exception of the Election Day are the same volatility, we can solve for the variance of Election Day. This may not be a reasonable assumption given other market uncertainties, but the assumption allows us to estimate the event volatility for the U.S. Elections on November 5.
12 Returns noted are inflation-adjusted total returns for the S&P 500 for each two-year federal election cycle since 1872. Returns for the S&P 500 are backfilled with returns for the S&P composite based on data provided by Robert Shiller prior to 1970. Returns based on the composition of the White House, Senate and House of Representatives after each two-year election cycle. Divided refers to periods in which all three are controlled by different parties, Strong Sweep refers to periods in which one party controls all three and has a large enough majority in the Senate to end a filibuster via cloture and Weak Sweep refers to all other periods in which one party controls all three.
13 https://elections2024.thehill.com/forecast/2024/senate/
14 https://elections2024.thehill.com/forecast/2024/house/
15 Please see our Q2 2024 Quarterly Statement “Seven Magnificent Charts of Concerning Historic Concentration in U.S. Large Cap Passive Indices”, Q2 2023 Quarterly Statement, “Concentration…64…No Repeats…Or Hesitation,” and May 2023 white paper “Concentration Traps of Equity Indexing“.
16 The Herfindahl-Hirschman Index (HHI) is a common measure of market concentration. The HHI is calculated by squaring the market share of each firm, and the “effective number of names” in an index is using the reciprocal of HHI. Please see Russell Rebalancing Into More Concentrated Growth for additional information on the effective number of names,
17 https://ir.nasdaq.com/news-releases/news-release-details/nasdaq-100-index-special-rebalance-be-effective-july-24-2023
All data is as of 9/30/2024 unless otherwise noted. Opinions represent those of Glenmede Investment Management LP (GIM) as of the date of this report and are for general informational purposes only. This document is intended for sophisticated, institutional investors only and is not intended to predict or guarantee the future performance of any individual security, market sector or the markets generally. GIM’s opinions may change at any time without notice to you. Any opinions, expectations or projections expressed herein are based on information available at the time of publication and may change thereafter, and actual future developments or outcomes (including performance) may differ materially from any opinions, expectations or projections expressed herein due to various risks and uncertainties. Information obtained from third parties, including any source identified herein, is assumed to be reliable, but accuracy cannot be assured. This paper represents the view of its authors as of the date it was produced, and may change without notice. There can be no assurance that the same factors would result in the same decisions being made in the future. In addition, the views are not intended as a recommendation of any security, sector or product. Returns reported represent past performance and are not indicative of future results. All results reported are of unmanaged indices, used just as illustrations for various market segments. These do not reflect what an actual investment in this sector would achieve, as it includes no accounting for trading costs or fees. Performance of any particular investment in one of these market segments could be lower or higher than what is reflected above.