The Quarterly Statement Q2 2024: Seven Magnificent Charts of Concerning Historic Concentration in U.S. Large Cap Passive Indices
Market Review Second Quarter 2024
What We Know: Q2 2024 Recap
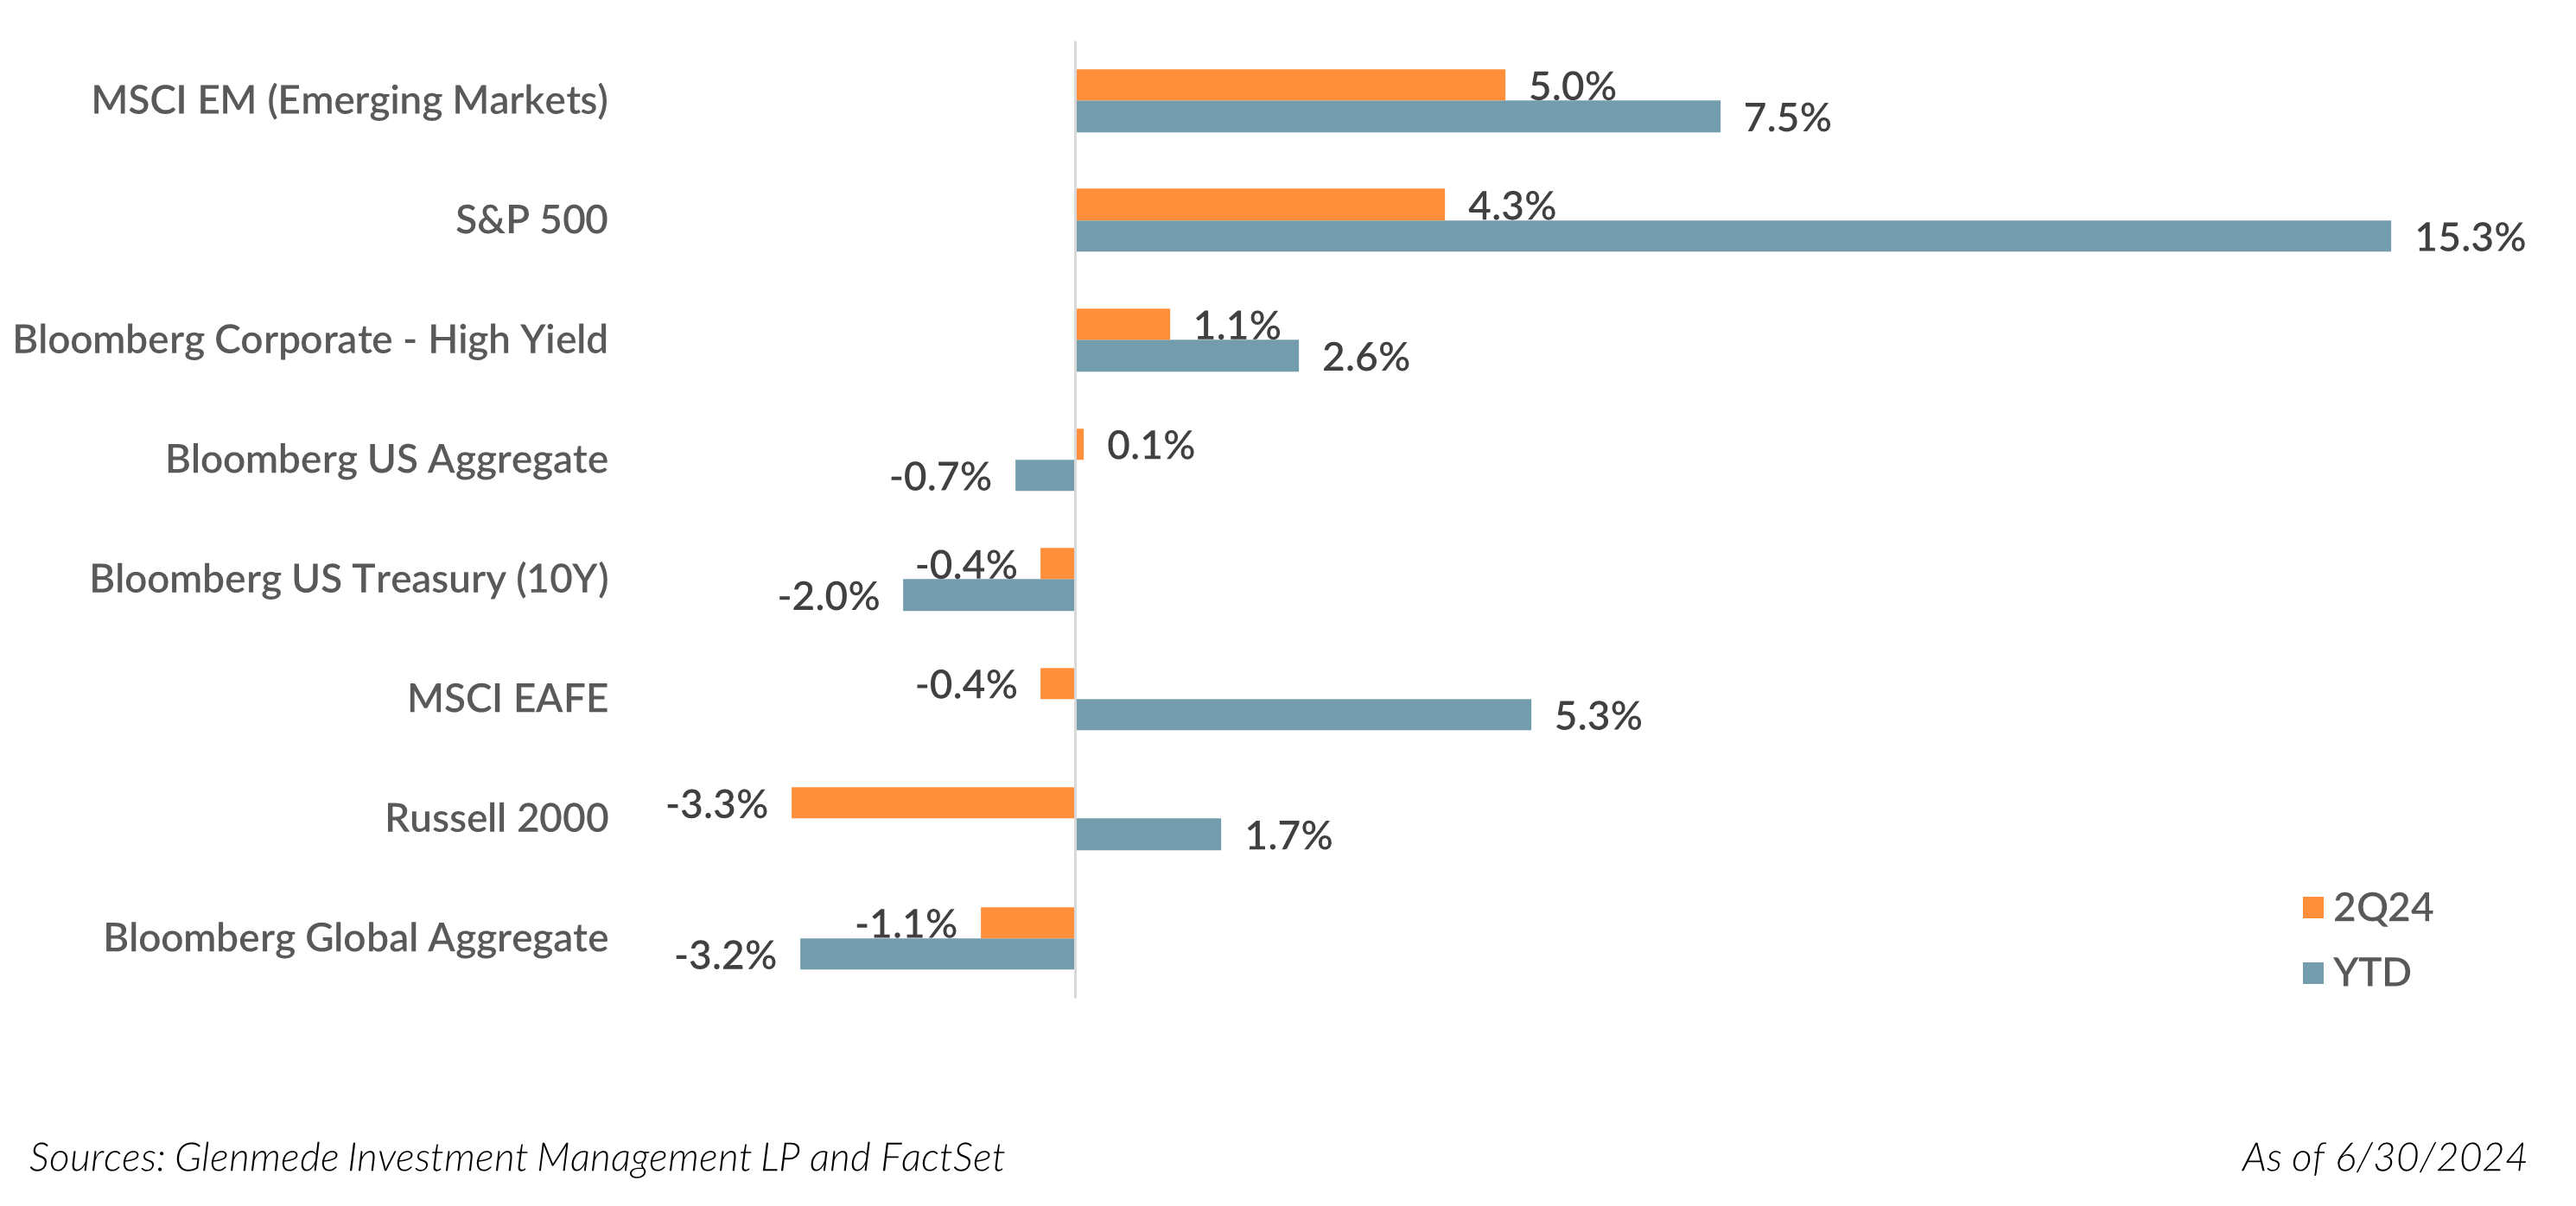
U.S. equity markets continued their bull-market rally with the S&P 500 Index reaching new market highs and gaining 4.3% for Q2 2024, bringing the year-to-date rally to 15.3%. Market concentration concerns remained, with the “Magnificent Seven” (Apple Inc., Microsoft Corporation, Alphabet Inc., Amazon.com, Inc., NVIDIA Corporation, Tesla, Inc. and Meta Platforms, Inc.) contributing more to the quarterly return of the S&P 500 Index than all other 493 companies combined (Magnificent Seven attribution was 5.0% and the remaining 493 was -0.7%, to bring the total return for the quarter to 4.3%). These same seven stocks have contributed 59% of the 15.3% year-to-date total return for the S&P 500 Index, with Tesla as the only negative contributor for the first half of the year. The S&P 500 Equal Weight Index saw a 2.6% drawdown this quarter, underperforming the S&P 500 Market Cap Index by 6.9%, the third largest quarterly underperformance since 1990. The equal weight index has underperformed the cap weighted index by 12.8% over the past year, the worst 4-quarter underperformance in 25 years. The NASDAQ 100 continued its run to new highs this quarter, finishing Q2 2024 up 8.0% and bringing the year-to-date total return to 17.5%.
While mega cap growth names dominated returns this quarter, value (using the Russell 1000 Value Index) lagged growth (using the Russell 1000 Growth Index) for the sixth consecutive quarter, with returns of -2.2% and 8.3%, respectively. Over the past six quarters, value has underperformed growth by a cumulative 53.4% (31.6% average annualized return). This is the second greatest six quarter underperformance of value to growth since 1979, when data-capture began. The six quarters ending Q1 2000 were the greatest on record when value underperformed growth by 55% cumulatively (31.8% average annualized return). While past performance is never a guarantee of future returns, the six quarters following Q1 2000 saw value outperform growth by 43.6%.
Sector returns of the S&P 500 Index finished mixed, with six facing negative returns and five experiencing positive returns1. The Information Technology sector was the top performer, returning 13.8% for the quarter and brining the one-year return to 41.8%. While Communication Services saw the second-best sector performance this quarter with a 9.4% return, the sector tops one-year sector returns at 44.7%. Magnificent Seven stocks are notable contributors to both sectors. The worst performing sector this quarter was Materials with a 4.5% drawdown.
Small cap continued to lag large cap, seeing negative returns for the quarter (Russell 2000 drawdown of 3.3% versus S&P 500 rally of 4.3%). Year-to-date, small cap lags large cap by 13.6% (1.7% for Russell 2000 versus 15.3% for S&P 500). Over the past five years, small cap has underperformed large cap by a cumulative 61.7% (8.1% average annualized return), with only six of 20 quarters experiencing small cap outperformance. As we have discussed many times2, we continue to believe the regime shift for small cap outperformance is on the horizon and think adding to a higher quality small cap allocation is attractive. We cannot predict when that will start, but we continue to argue there is an attractive risk/reward potential for higher quality small caps, particularly relative to passive large caps.
In international markets, Emerging Markets (MSCI Emerging Markets Index) led the way with a quarterly return of 5.0%. Developed international (MSCI EAFE Index) was mostly flat on the quarter with a return of -0.4%.
The U.S. Treasury curve steepened slightly, as investor expectations for the FOMC to cut rates decreased to potentially two cuts, down considerably from the “hoped for” six cuts investors were pricing in as of the end of 2023. The 2Y yield rose 13 basis points to yield 4.76%, and the 10Y yield rose by 19 basis points to yield 4.39% as investor expectations changed. The U.S. Treasury 10Y-2Y yield spread, a much-watched recessionary indicator, finished the quarter at -37 basis points, tightening slightly from Q1 2024’s -42 basis points.
What We Debate: A Practitioner’s Perspective
“Mimicking the herd invites regression to the mean.” – Charlie Munger
While the ‘Magnificent Seven’ continue to dominate headlines and returns (59% of year-to-date returns for the S&P 500 of 15.3%), we highlight seven magnificent charts illustrating how unprecedented the current concentration of several U.S. equity large cap passive indices is and potential reasons to consider diversifying away from these passive allocations.
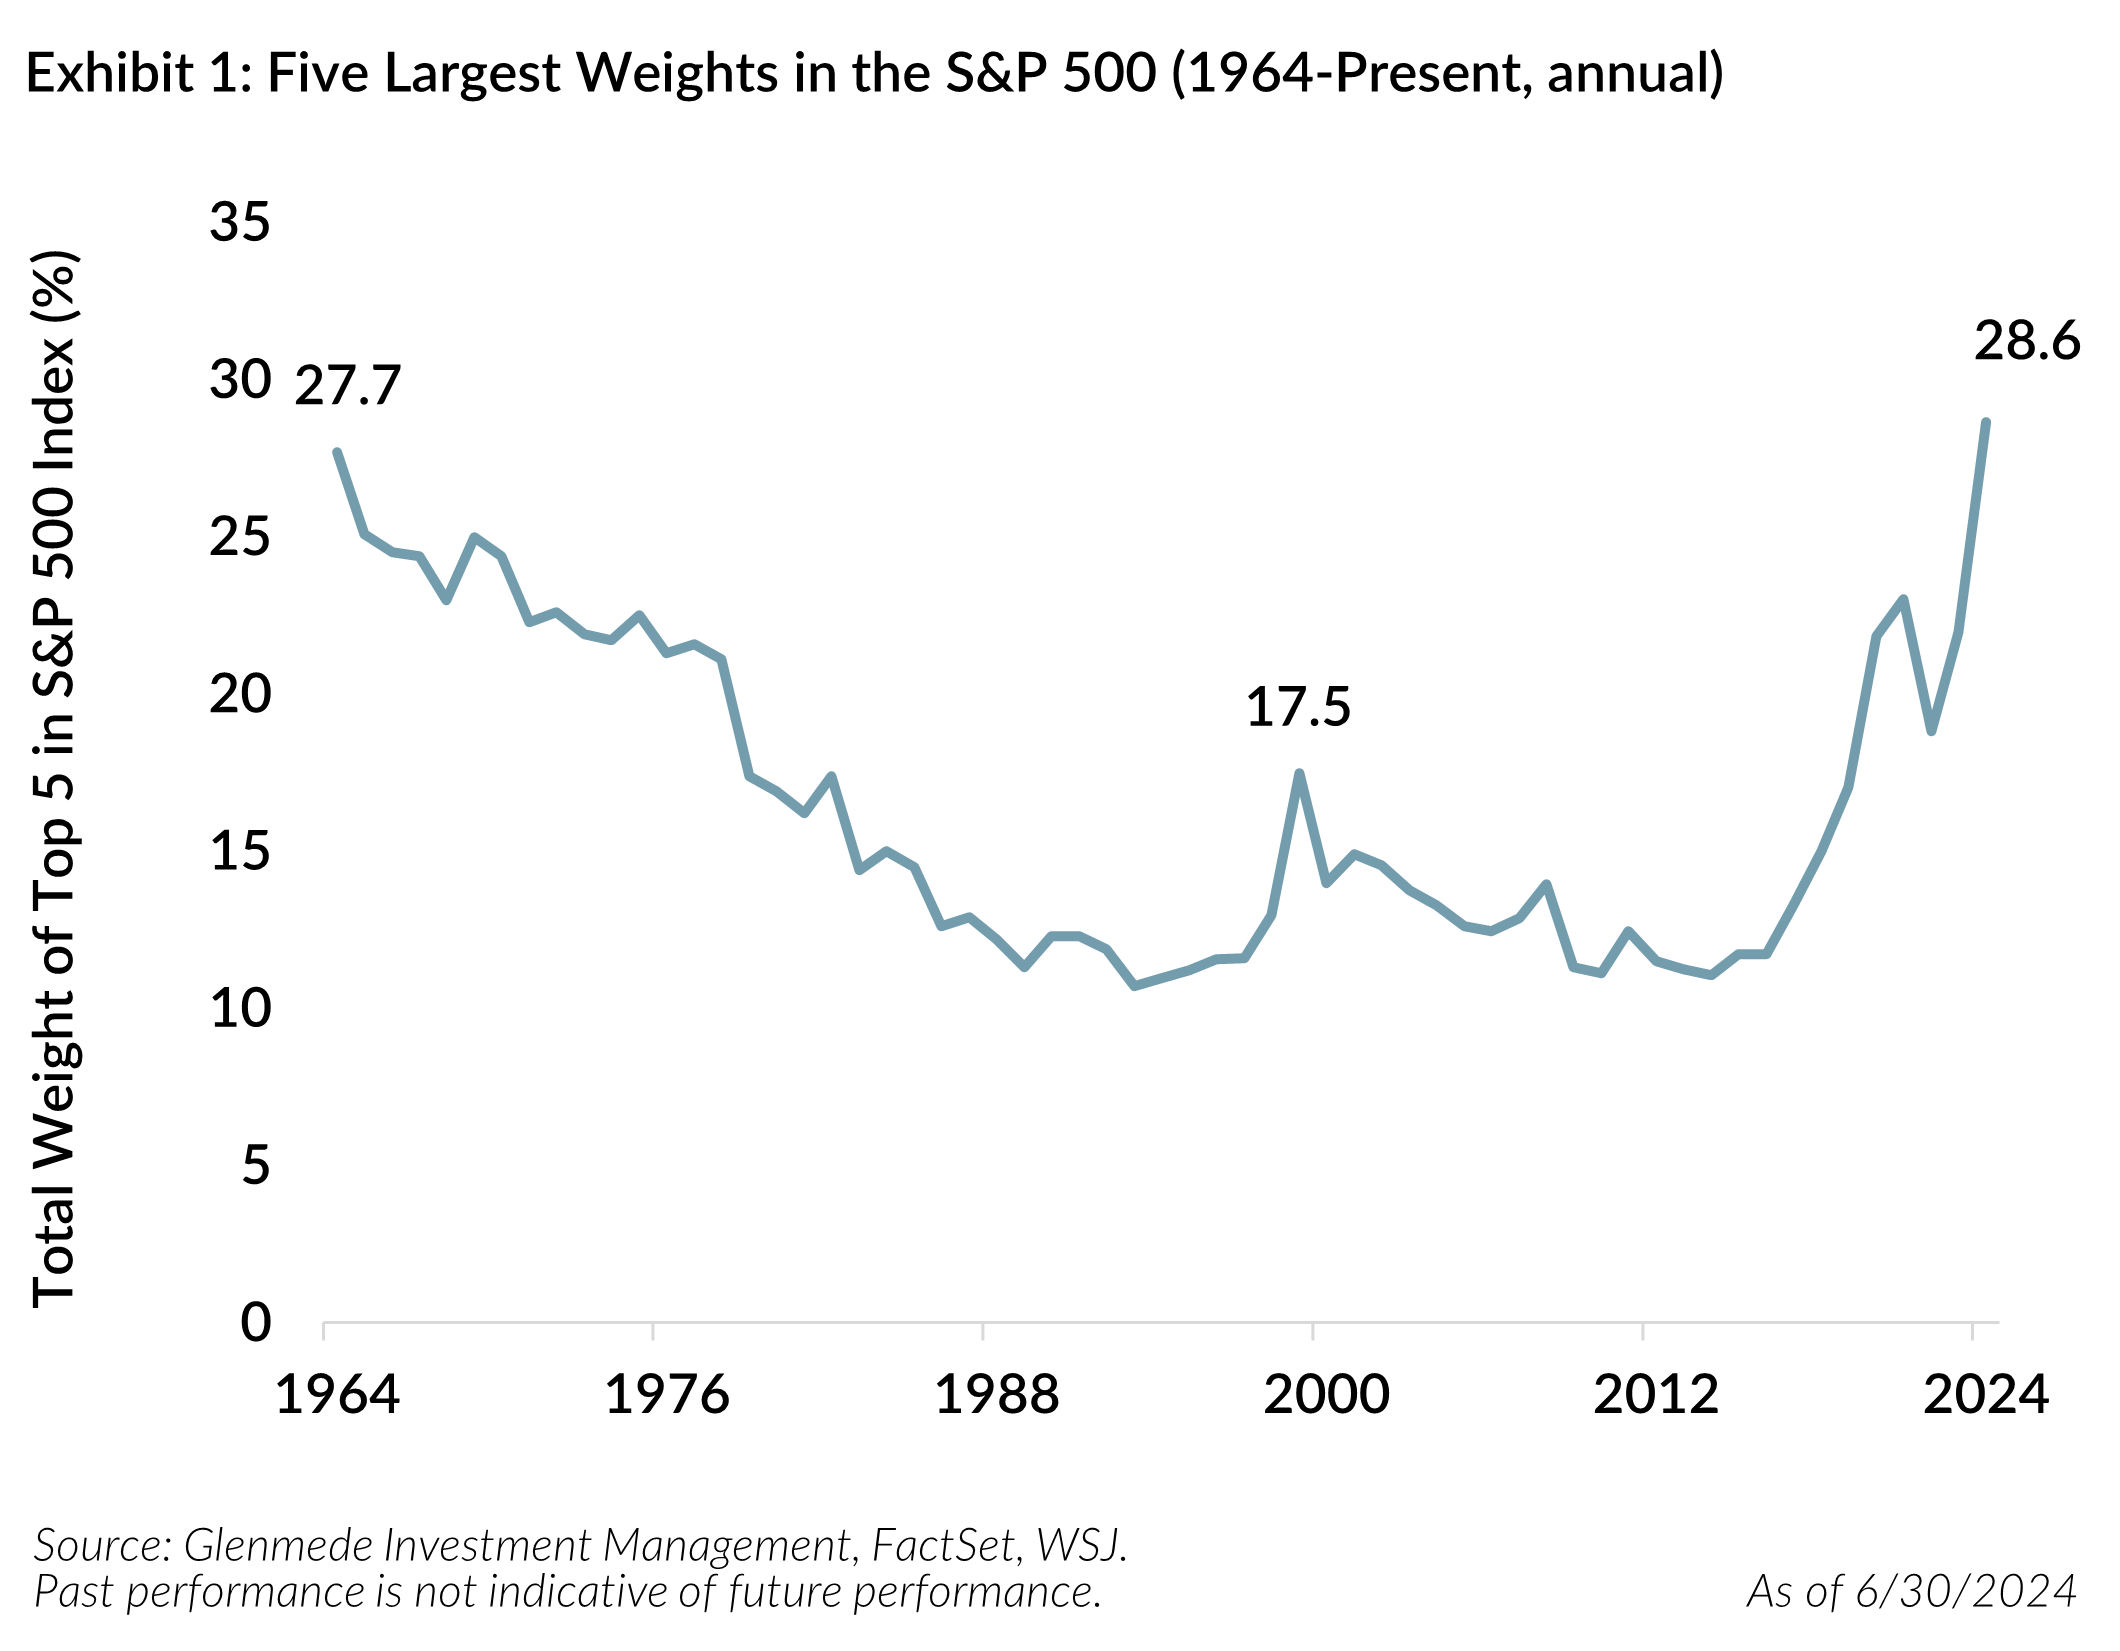
1. S&P 500 Index Breaks Its Own 60-Year Peak Concentration Record
Exhibit 1 shows the five largest weights of the S&P 500 Index as of year-end since 1964.
Concern: While the exposure to a concentrated large cap passive strategy is good when the top weights are outperforming, the risk is obviously that the index no longer offers the same level of diversification.
Based on year-end data from 1964 to present, the top five components by weight of the S&P 500 Index reached a record accounting for 28.6% at Q2 2024, surpassing the 1964 record of 27.7%3. From 1964 until 1993, the top five weights steadily declined to 10.7%, with an average weighting over the past 60 years of 16.5%.
Even as media coverage of market concentration has intensified this past year, the issue has only become more pronounced. In the past six months alone, the top five weight has increased from 24.3% to 28.6%. Since the end of 2014, the weight of the top five has almost tripled from 10.9%.
It could get worse. Concentration might continue as the shift to passive from active strategies means, in effect, more dollars are being spent on the higher weighted stocks than lower weighted stocks. With little selling pressure to offset the demand, and little slowdown in the desire for passive in U.S. large cap allocations, concentration can, well, get more concentrated4. For those who believe that a broad-based passive index like the S&P 500 is supposed to offer a well-diversified portfolio of stocks across various sectors and industries, this is a concern.
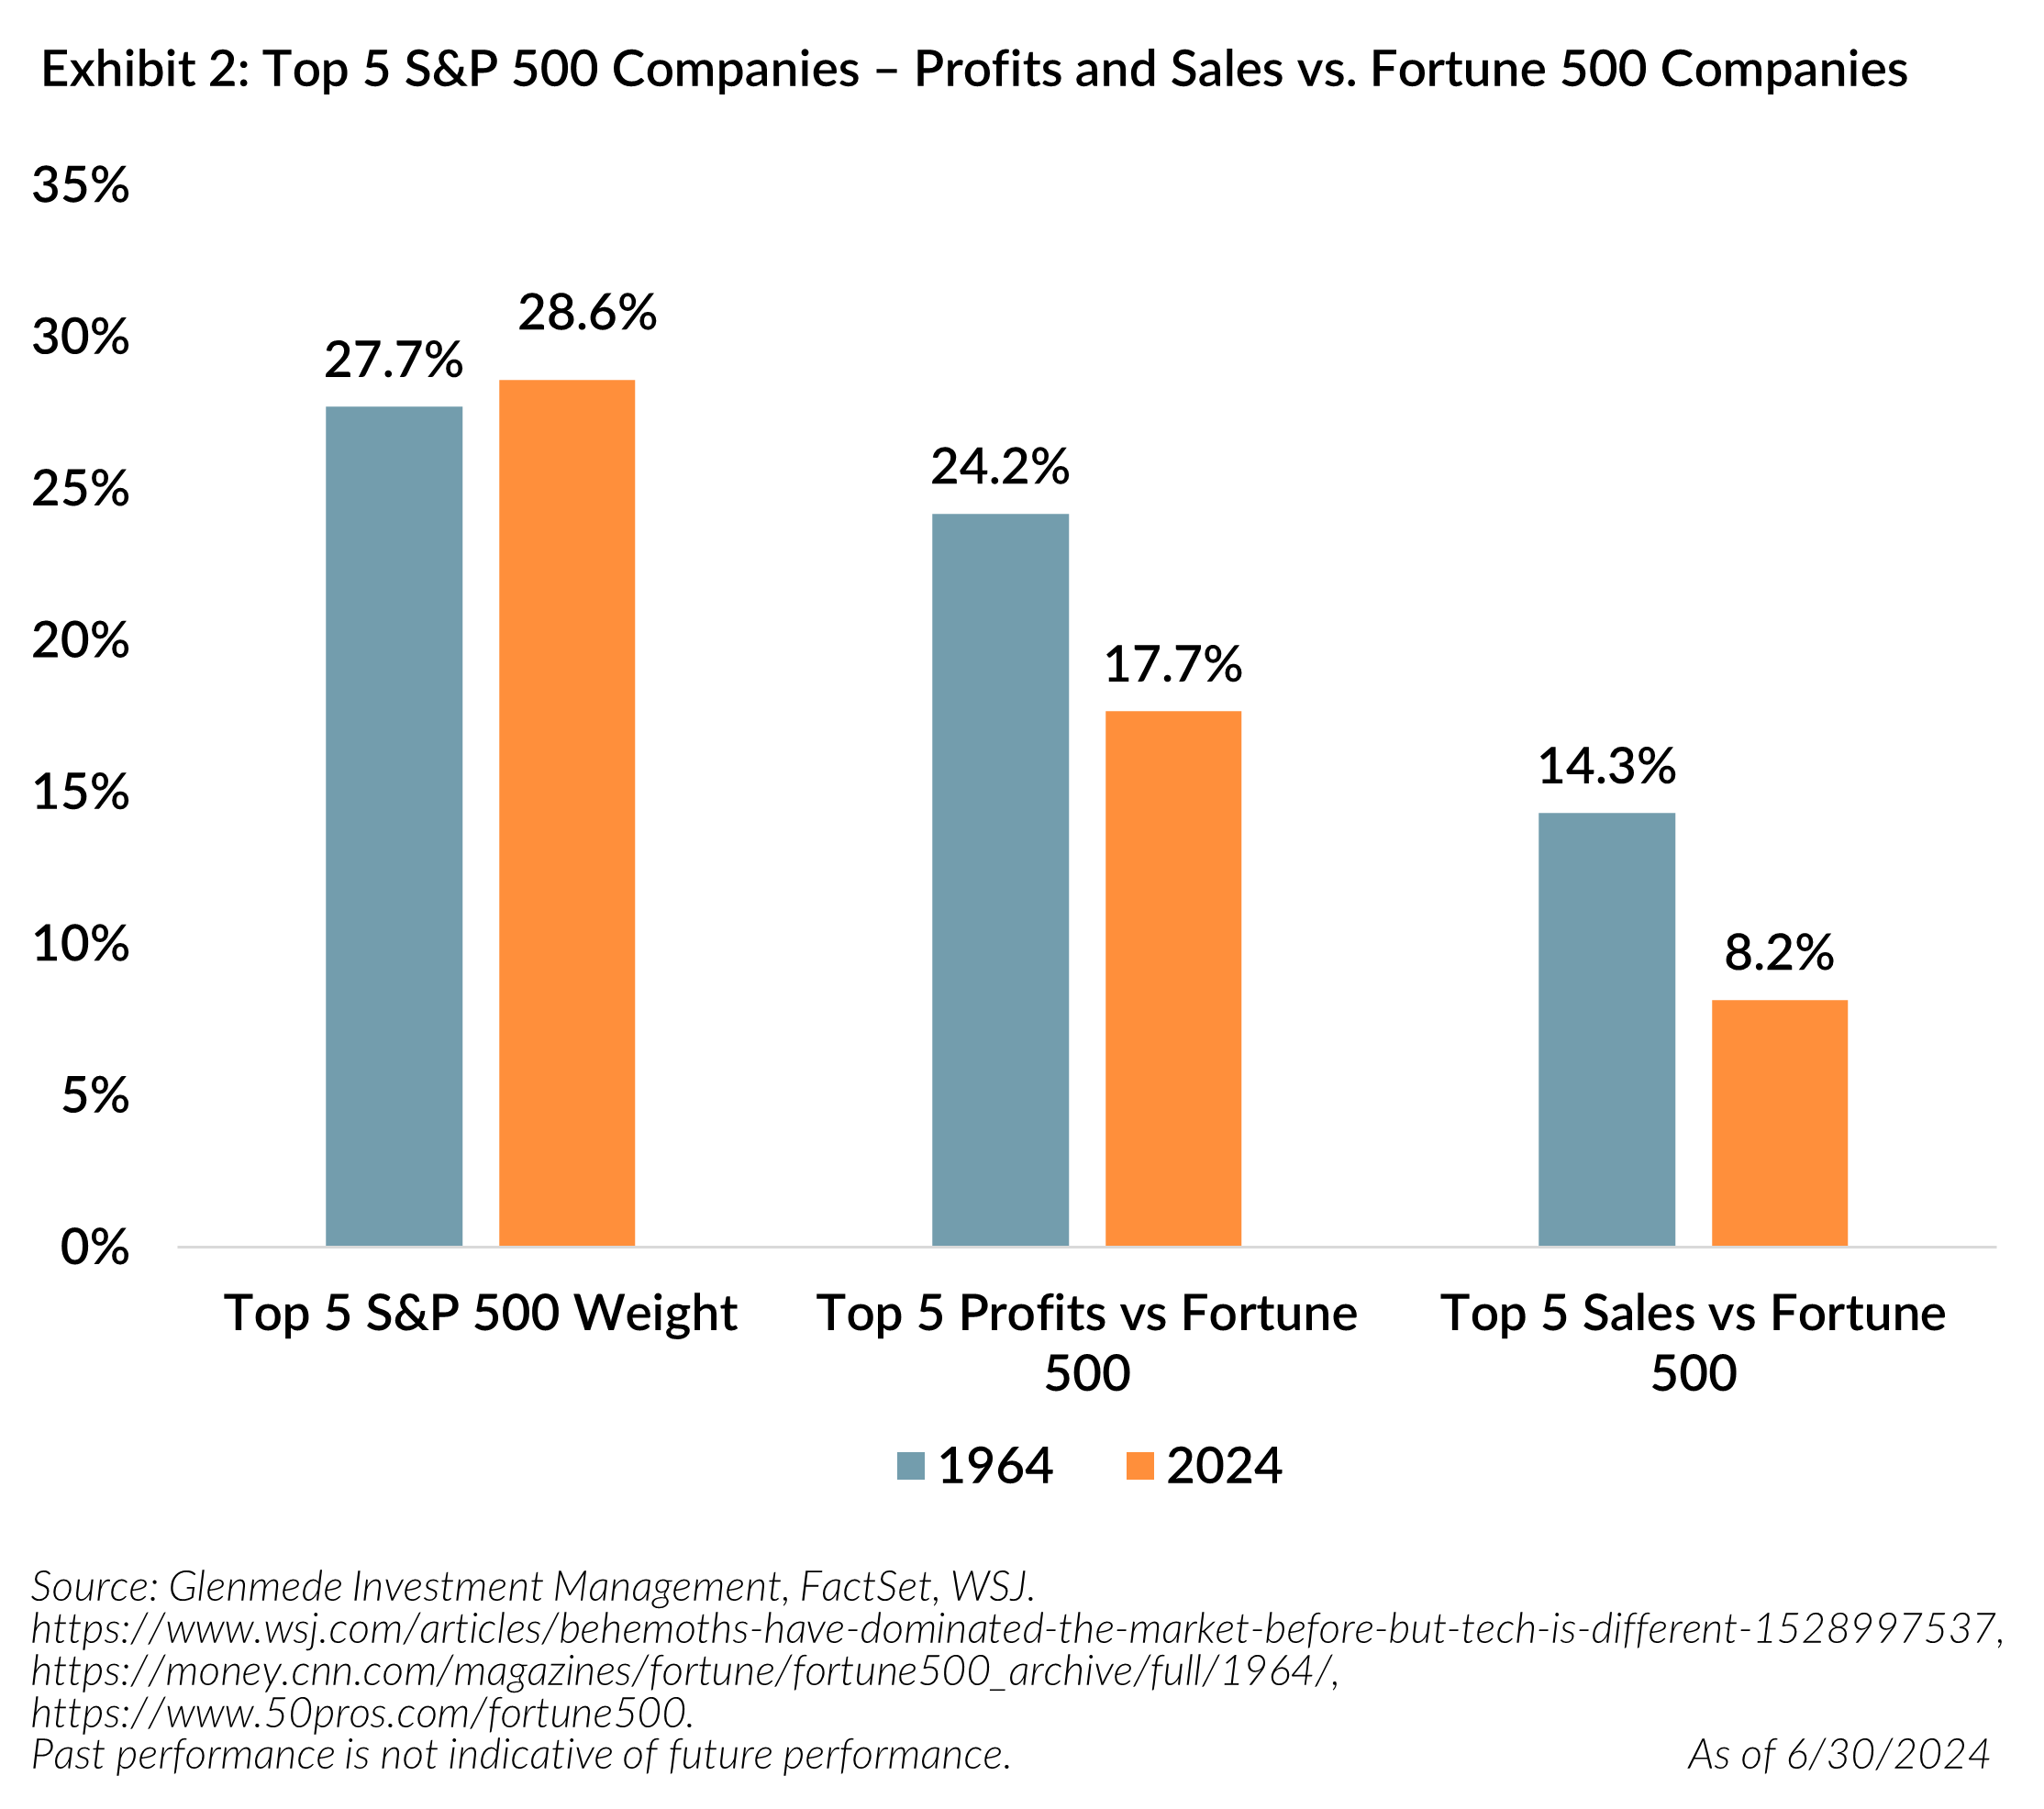
 2. Concentration Not Keeping Pace with Sales and Profits of Fortune 500 Companies
Exhibit 2 compares current S&P 500 Index top five constituent weights, profits and sales to those in 1964.
Concern: Passive fans might argue that sales, profits and growth potential are greater in the higher weighted companies of the S&P 500 Index than other areas of the market and so there is no extra risk in a concentrated index. Neither profits nor sales of the top five companies relative to the Fortune 500 is greater than it was at the prior peak in 1964, as shown below. We believe future growth is an expectation partially based on current sales and profits, and what we are seeing there is not as robust as it was in 19645. We think the record concentration of the S&P 500 absent an accompanying record profit or sales percentage of Fortune 500 companies could reflect potentially unrealistic expectations of growth priced into the valuations of the largest names, increasing the risk for volatility and underperformance for strategies with concentration risk.
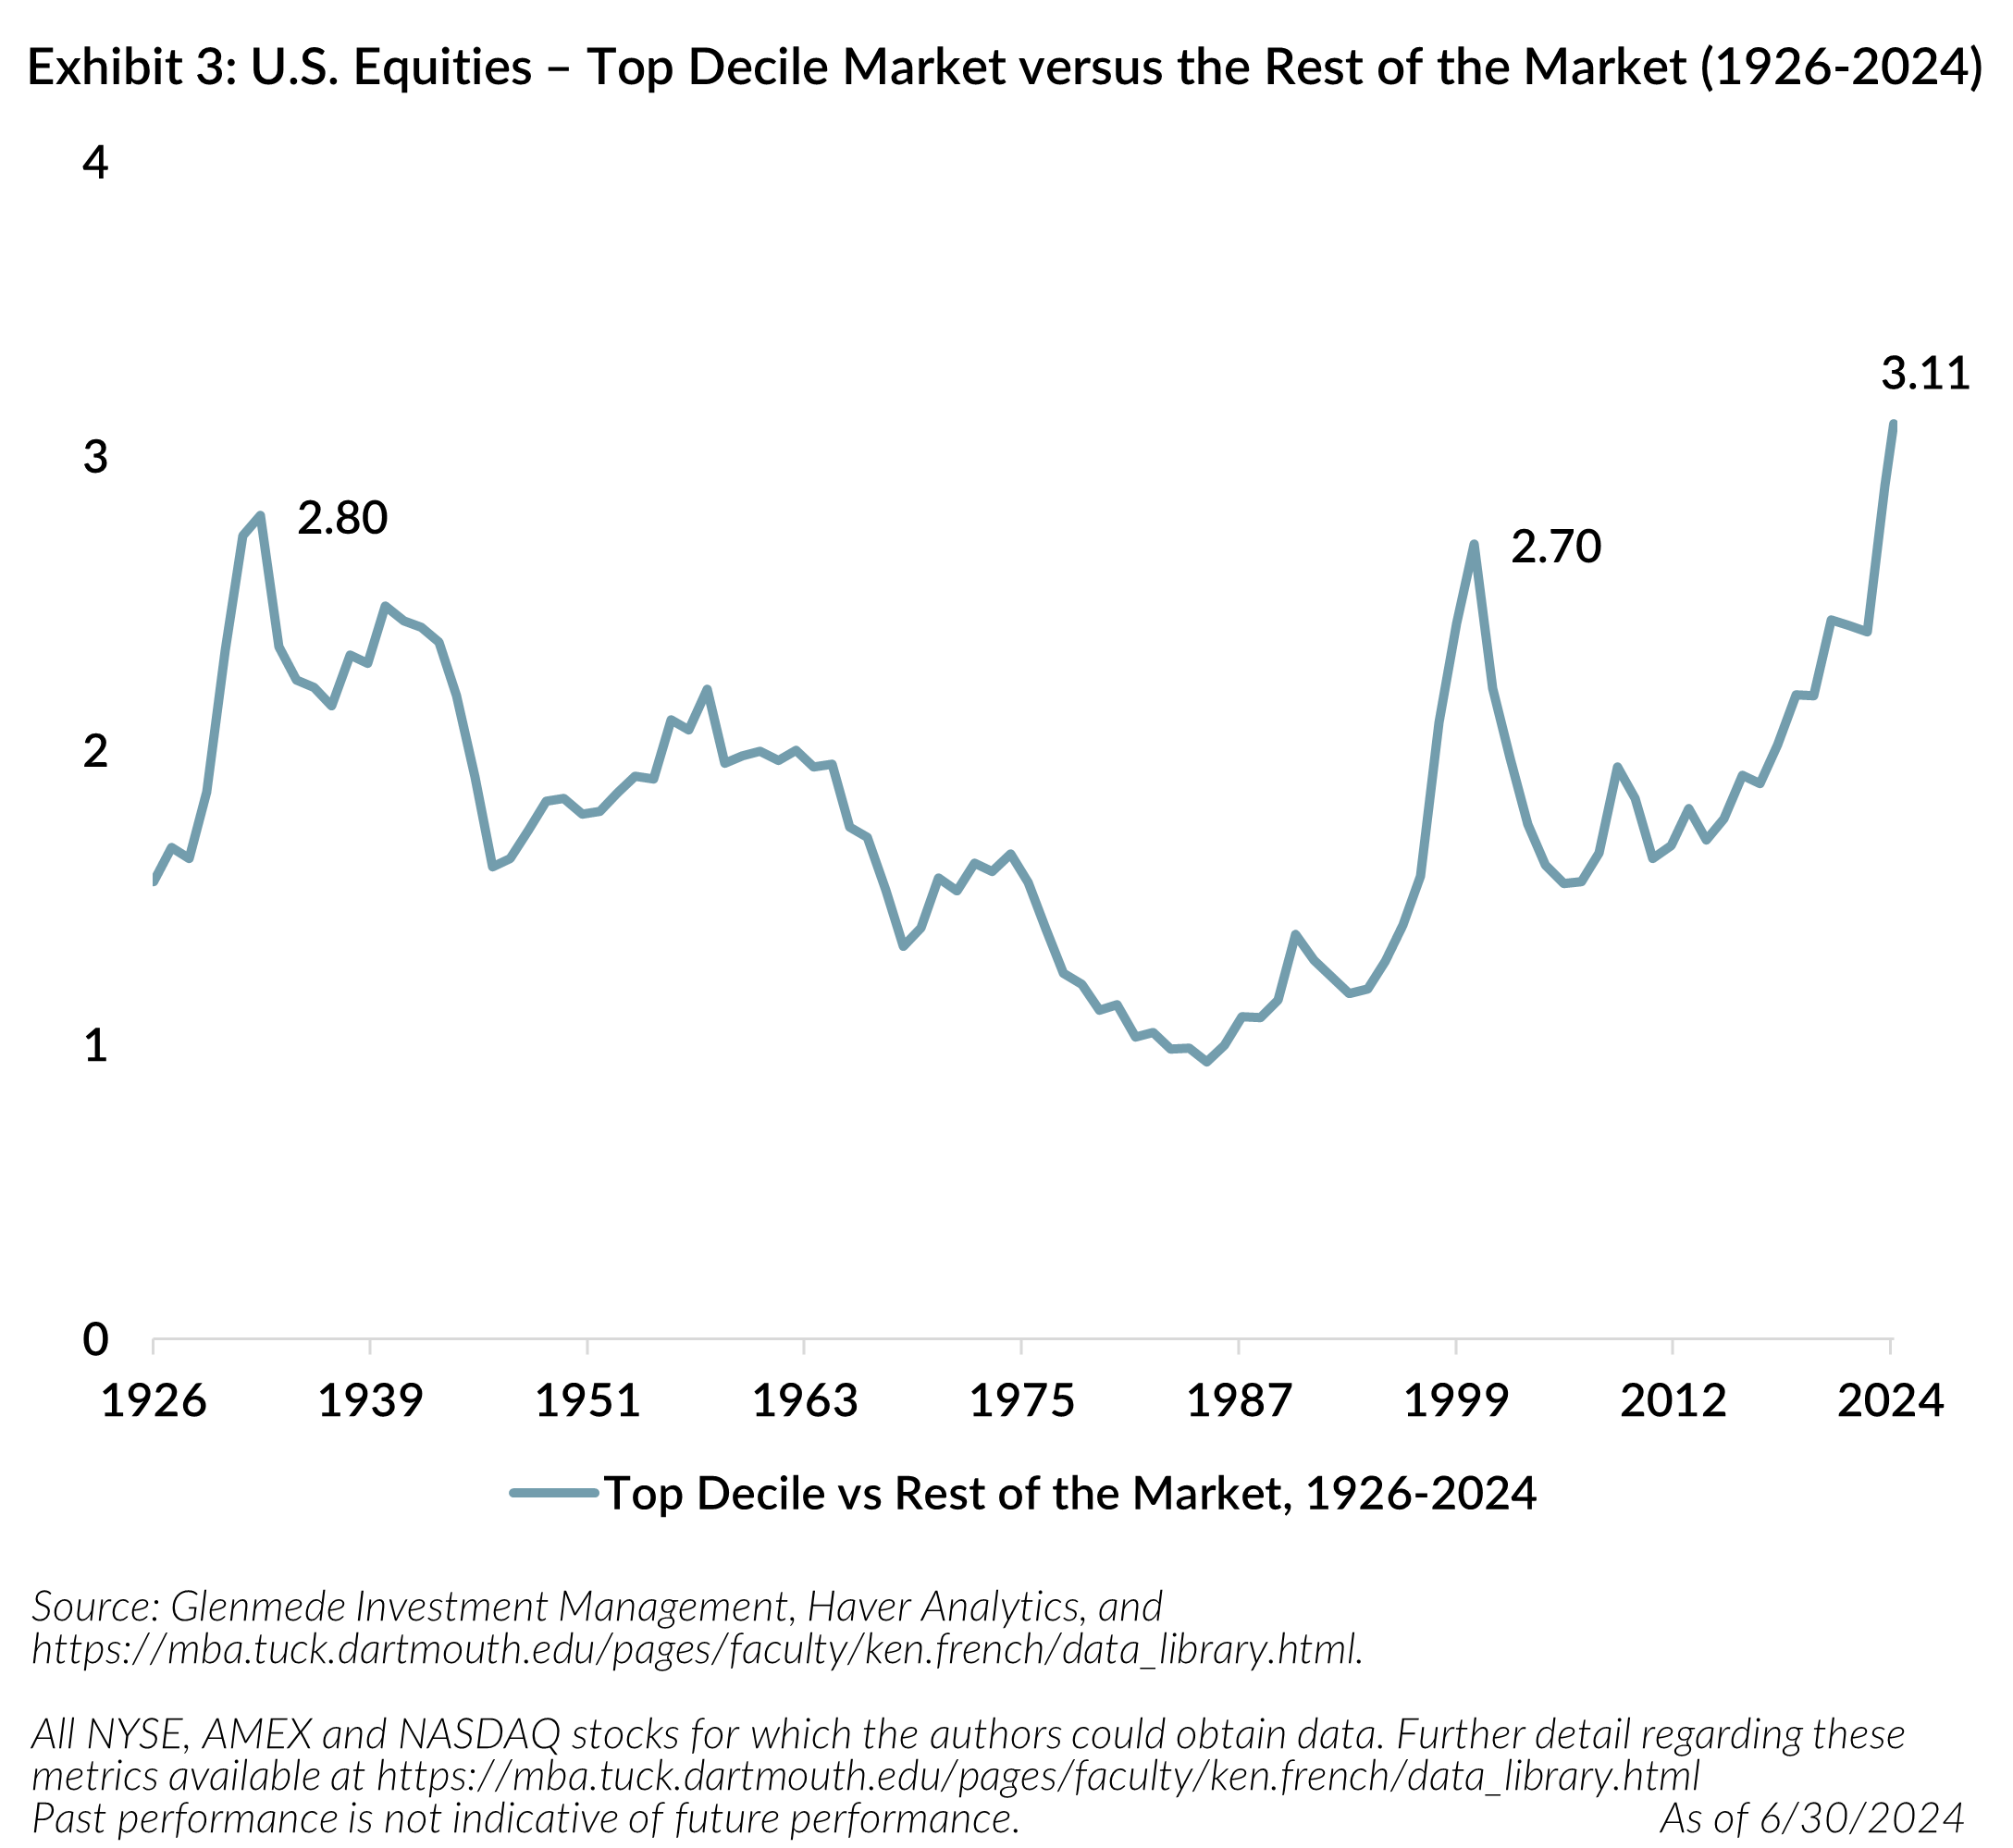
3. Market Cap of the Top Decile of U.S. Equities is Now Three Times Larger Than the Rest of the Market
Exhibit 3 uses Fama-French data6 to compare the market cap ratio of the top decile to the rest of the market.
Concern: The top decile of all U.S. publicly traded companies (not just the S&P 500) features a market cap more than three times the size of the remaining 90%, the largest divergence in almost 100 years. Normalization happens, but without a predictable trajectory. For example, that process appears slow in the 1930s but dramatic following the dotcom bust in the . Our concern here is that a very top-heavy market has historically been around market bubbles and passive large cap allocations with less diversification may increase volatility for investors in a time when there is little predictability around market volatility.
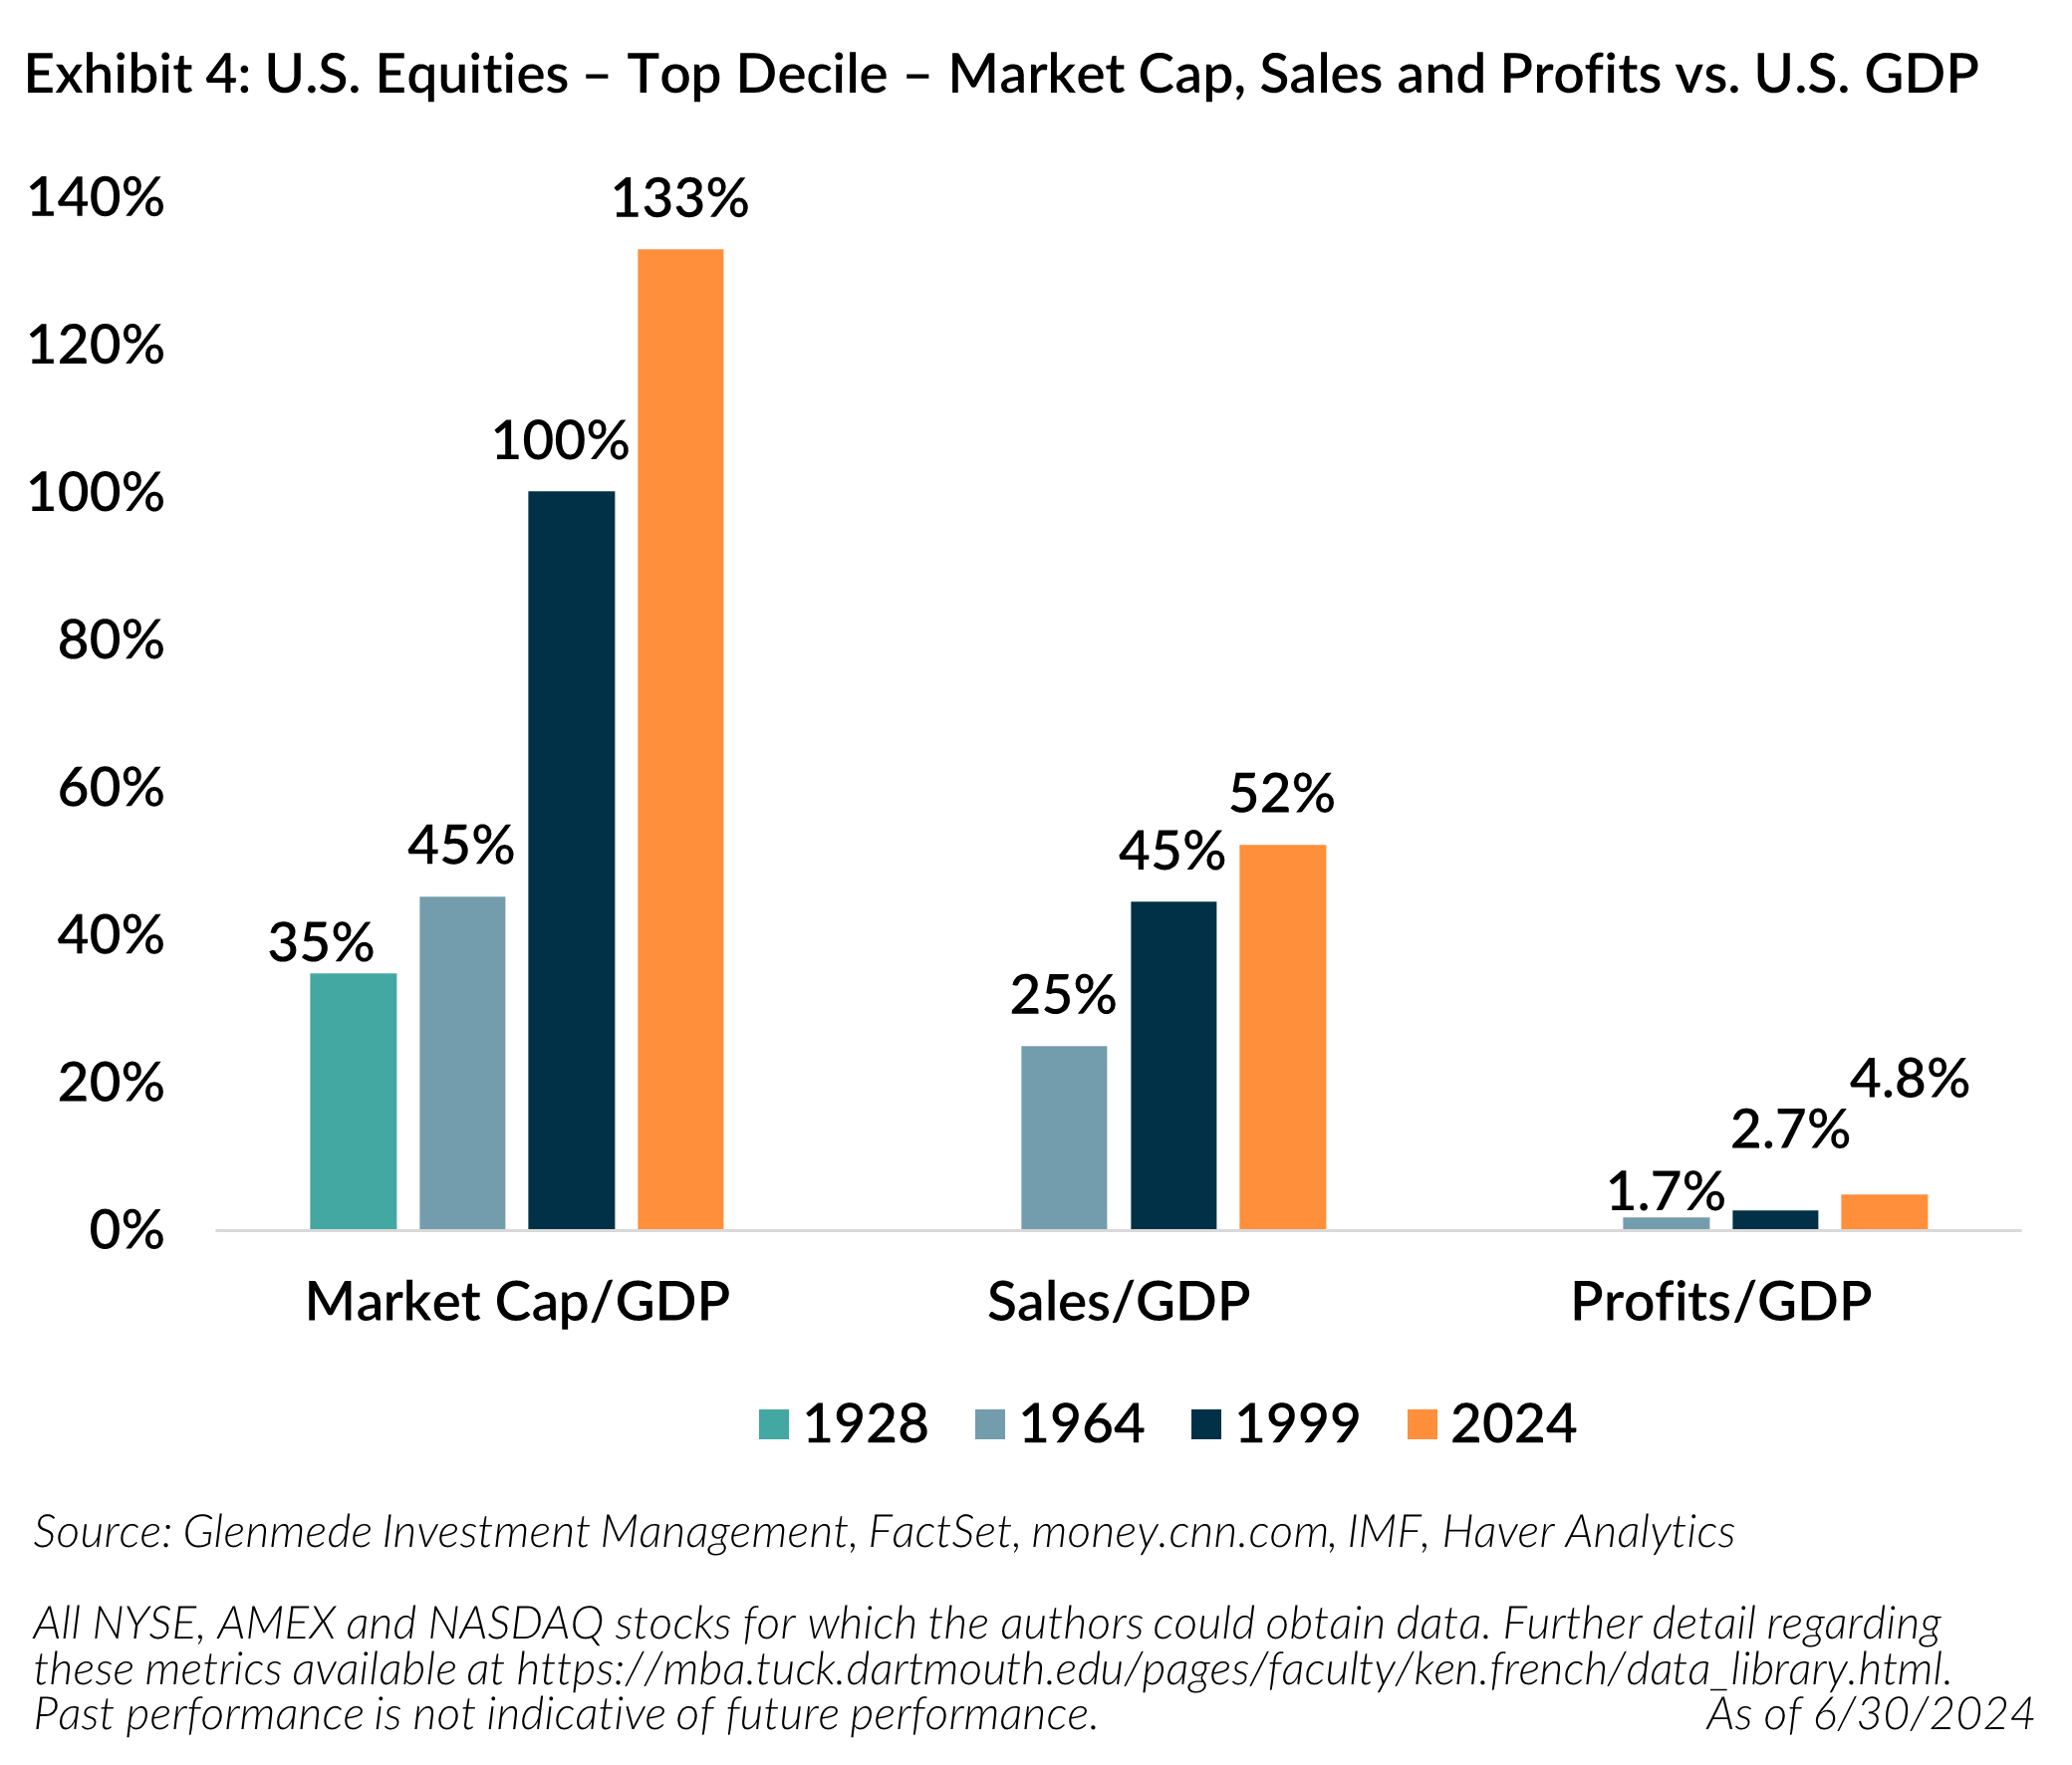
4. Top Decile of U.S. Equities now 133% of U.S. GDP
Exhibit 4 compares the current market cap, sales and profits of the top decile of U.S. equities versus U.S. GDP to previous periods of market concentration (1928, 1964 and 1999).
Concern: Current U.S. market concentration is even more unusual when compared to U.S. GDP. The top decile of U.S. equities now has a market cap that is 133% of U.S. GDP. During previous periods of concentration (1928, 1964 and 1999), the market cap of the top decile was 35%, 45% and 100% of U.S. GDP. When incorporating sales and profits versus U.S. GDP, the current environment suggests an even more extreme environment7, particularly relative to 1964. The current level versus 1964 has a market cap/GDP ratio of 3.0x, while both sales and profits are less (2.1x and 2.8x higher, respectively). Relative to 1999, which was considered a time of extreme valuations, the current environment has a market cap/GDP ratio of 1.3x, while sales and profits are mixed (1.2x and 1.8x higher, respectively). Given the market cap of the top decile is not staying proportional to the profits and sales in previous periods, the valuations of the top decile companies may be pricing in extremely optimistic expectations for future growth just as there was in 1999, but with even more concentration. If the growth fails to be realized, some of these stocks may see valuation compression, which could add risk to concentrated portfolios. We recognize that globalization could be a contributing factor to current market cap exceeding U.S. GDP, which we address in section 5.
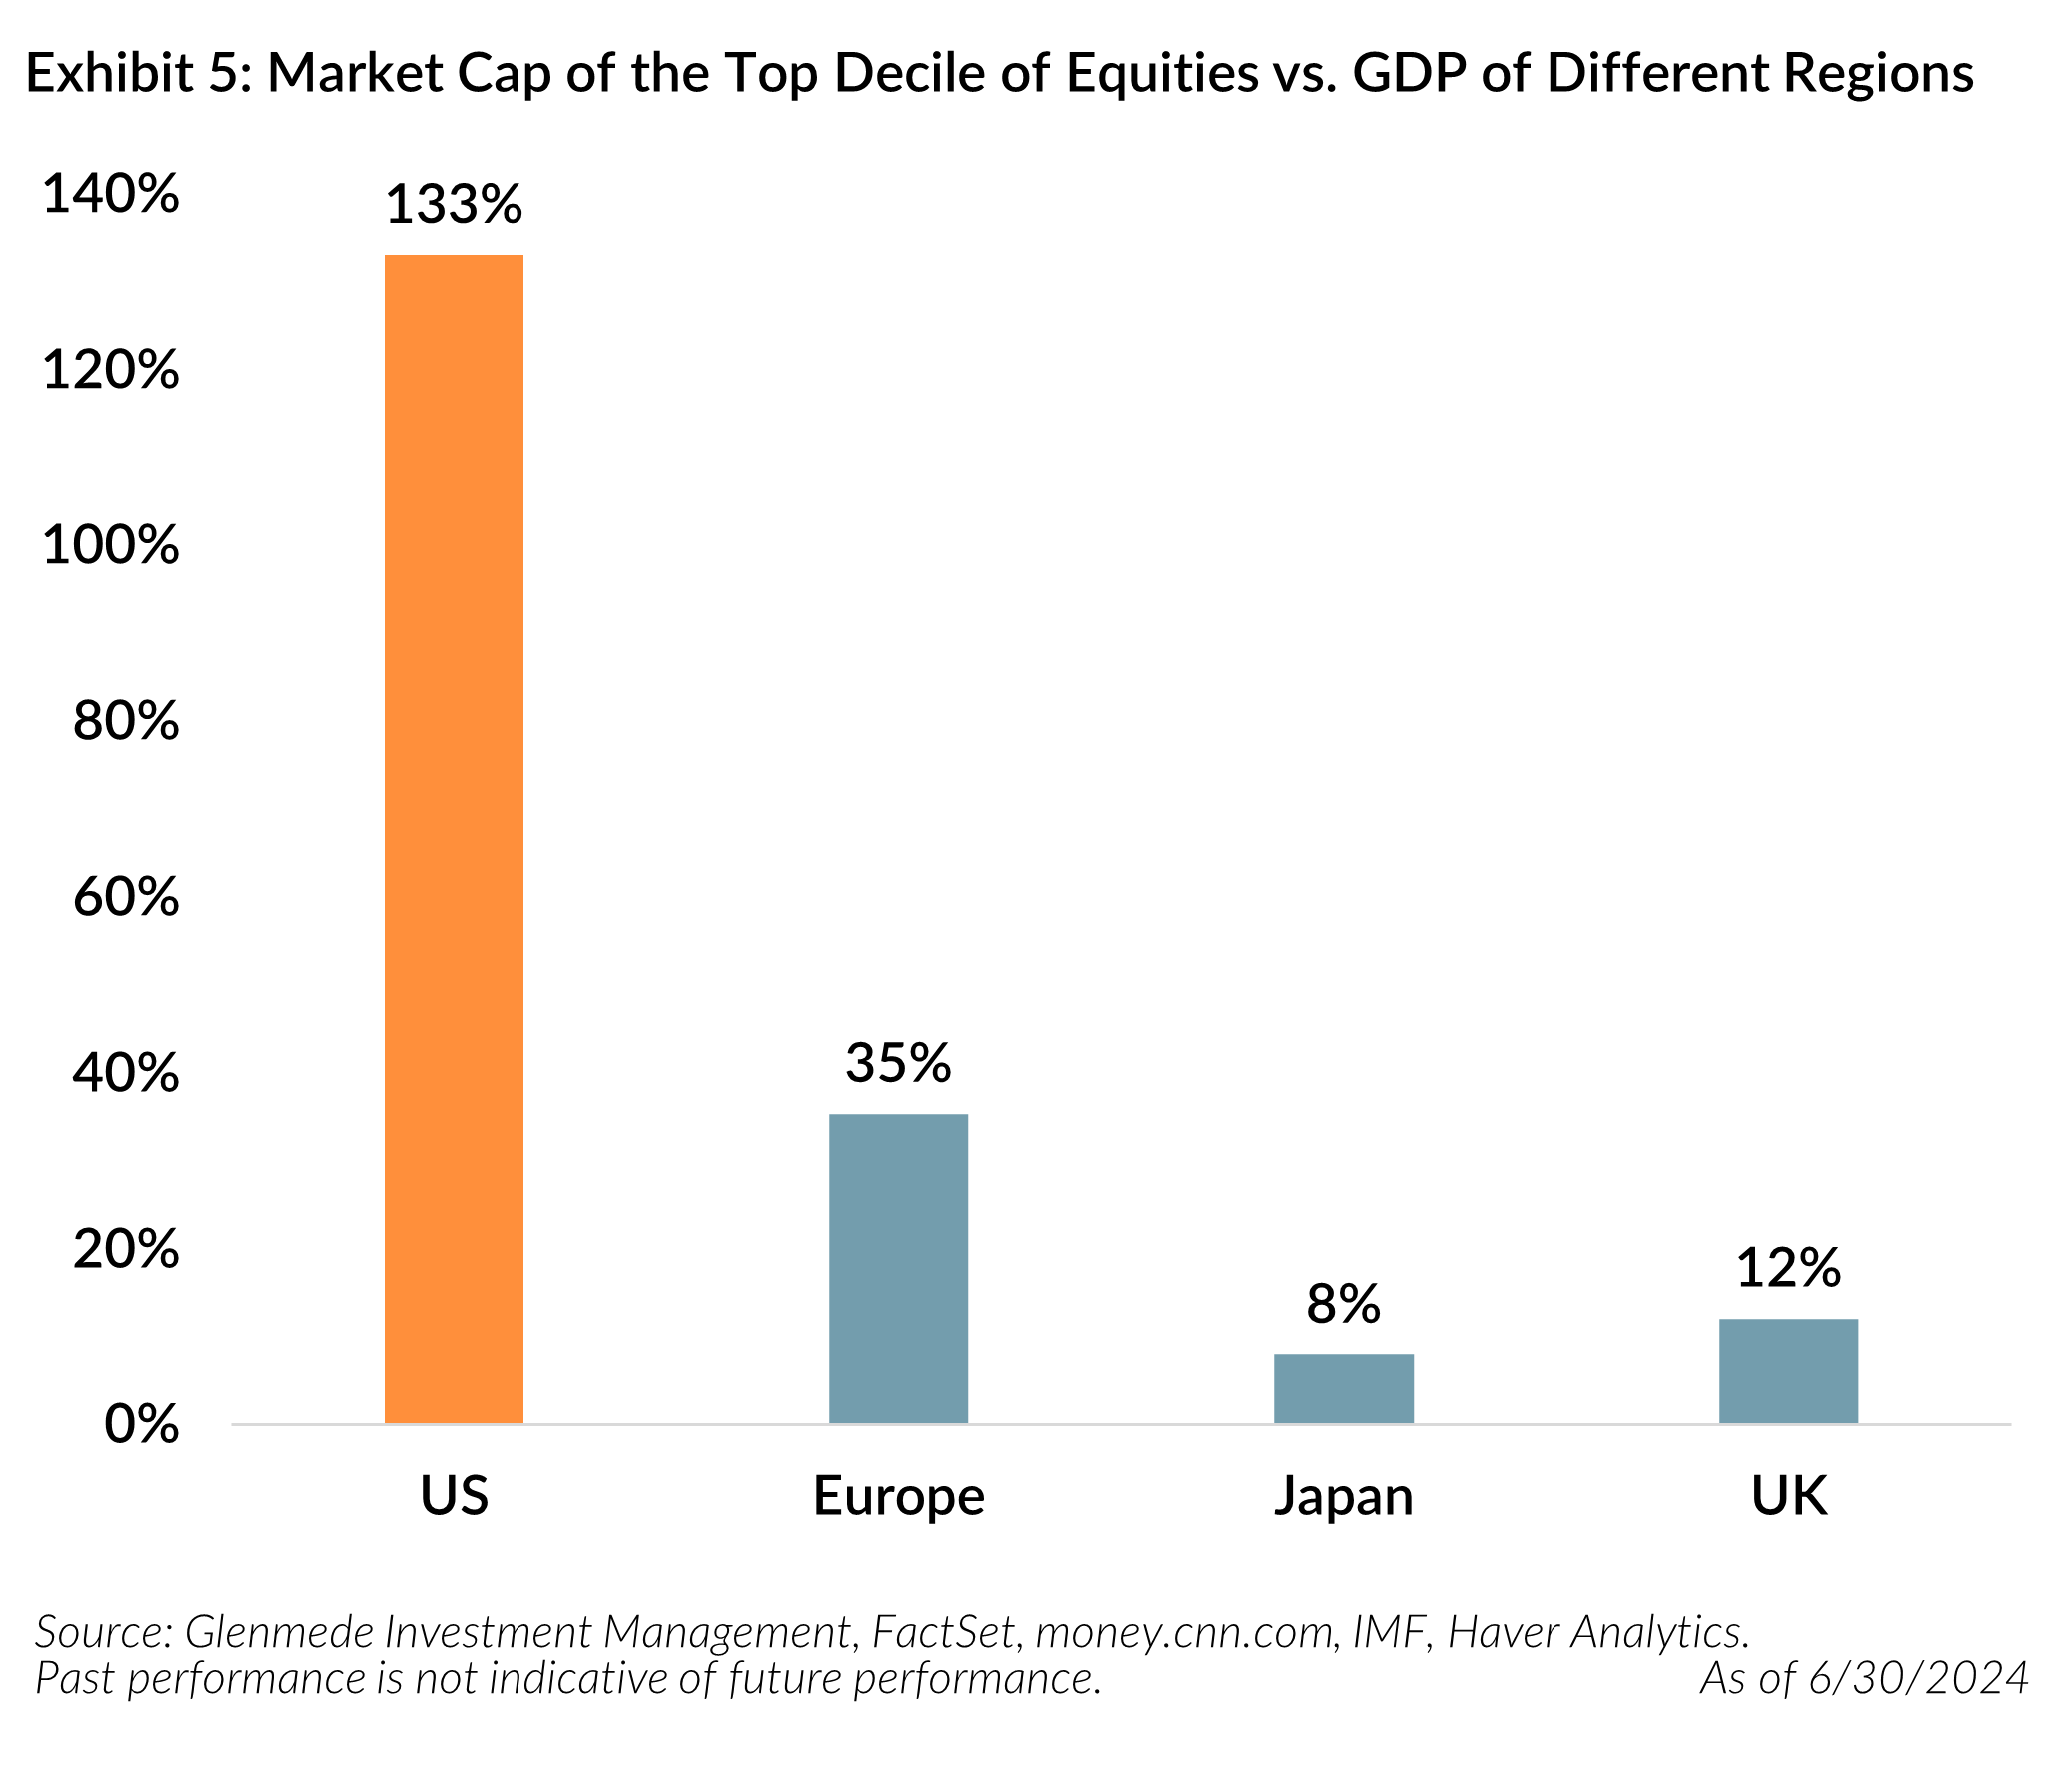
5. Current Market Cap of the Top Decile of Equities is Significantly Greater Versus GDP of Different Geographies
Exhibit 5 compares the current market cap of the top decile of equities in different geographic regions versus each region’s GDP.
Concern: Globalization does not necessarily explain the US GDP ratio. At 133%, the U.S. GDP ratio is significantly greater than the GDP ratio of the top decile of equities in other developed markets (Europe, 35%; Japan, 8% and United Kingdom, 12%). More than half of sales among domestic mega caps (55.8% of sales in the Russell top 200) come from the U.S., so globalization cannot account for this stark difference in size.
Our concern is that current valuations of the top decile of equities in the U.S. suggests a lack of participation worldwide that may not reflect reality. If some of the technological advancement expectations that have contributed to the recent rally of some mega cap technology companies materialize, we would expect more than just the U.S. or the top decile of companies to benefit from these advancements. Current levels would suggest limited participation of other regions or companies relative to the U.S. top decile of companies, or a potential overestimate of the benefit to the U.S. top decile. In either case, we believe diversifying from the top decile makes sense.
6. Russell Large Cap Styles are at Extremes
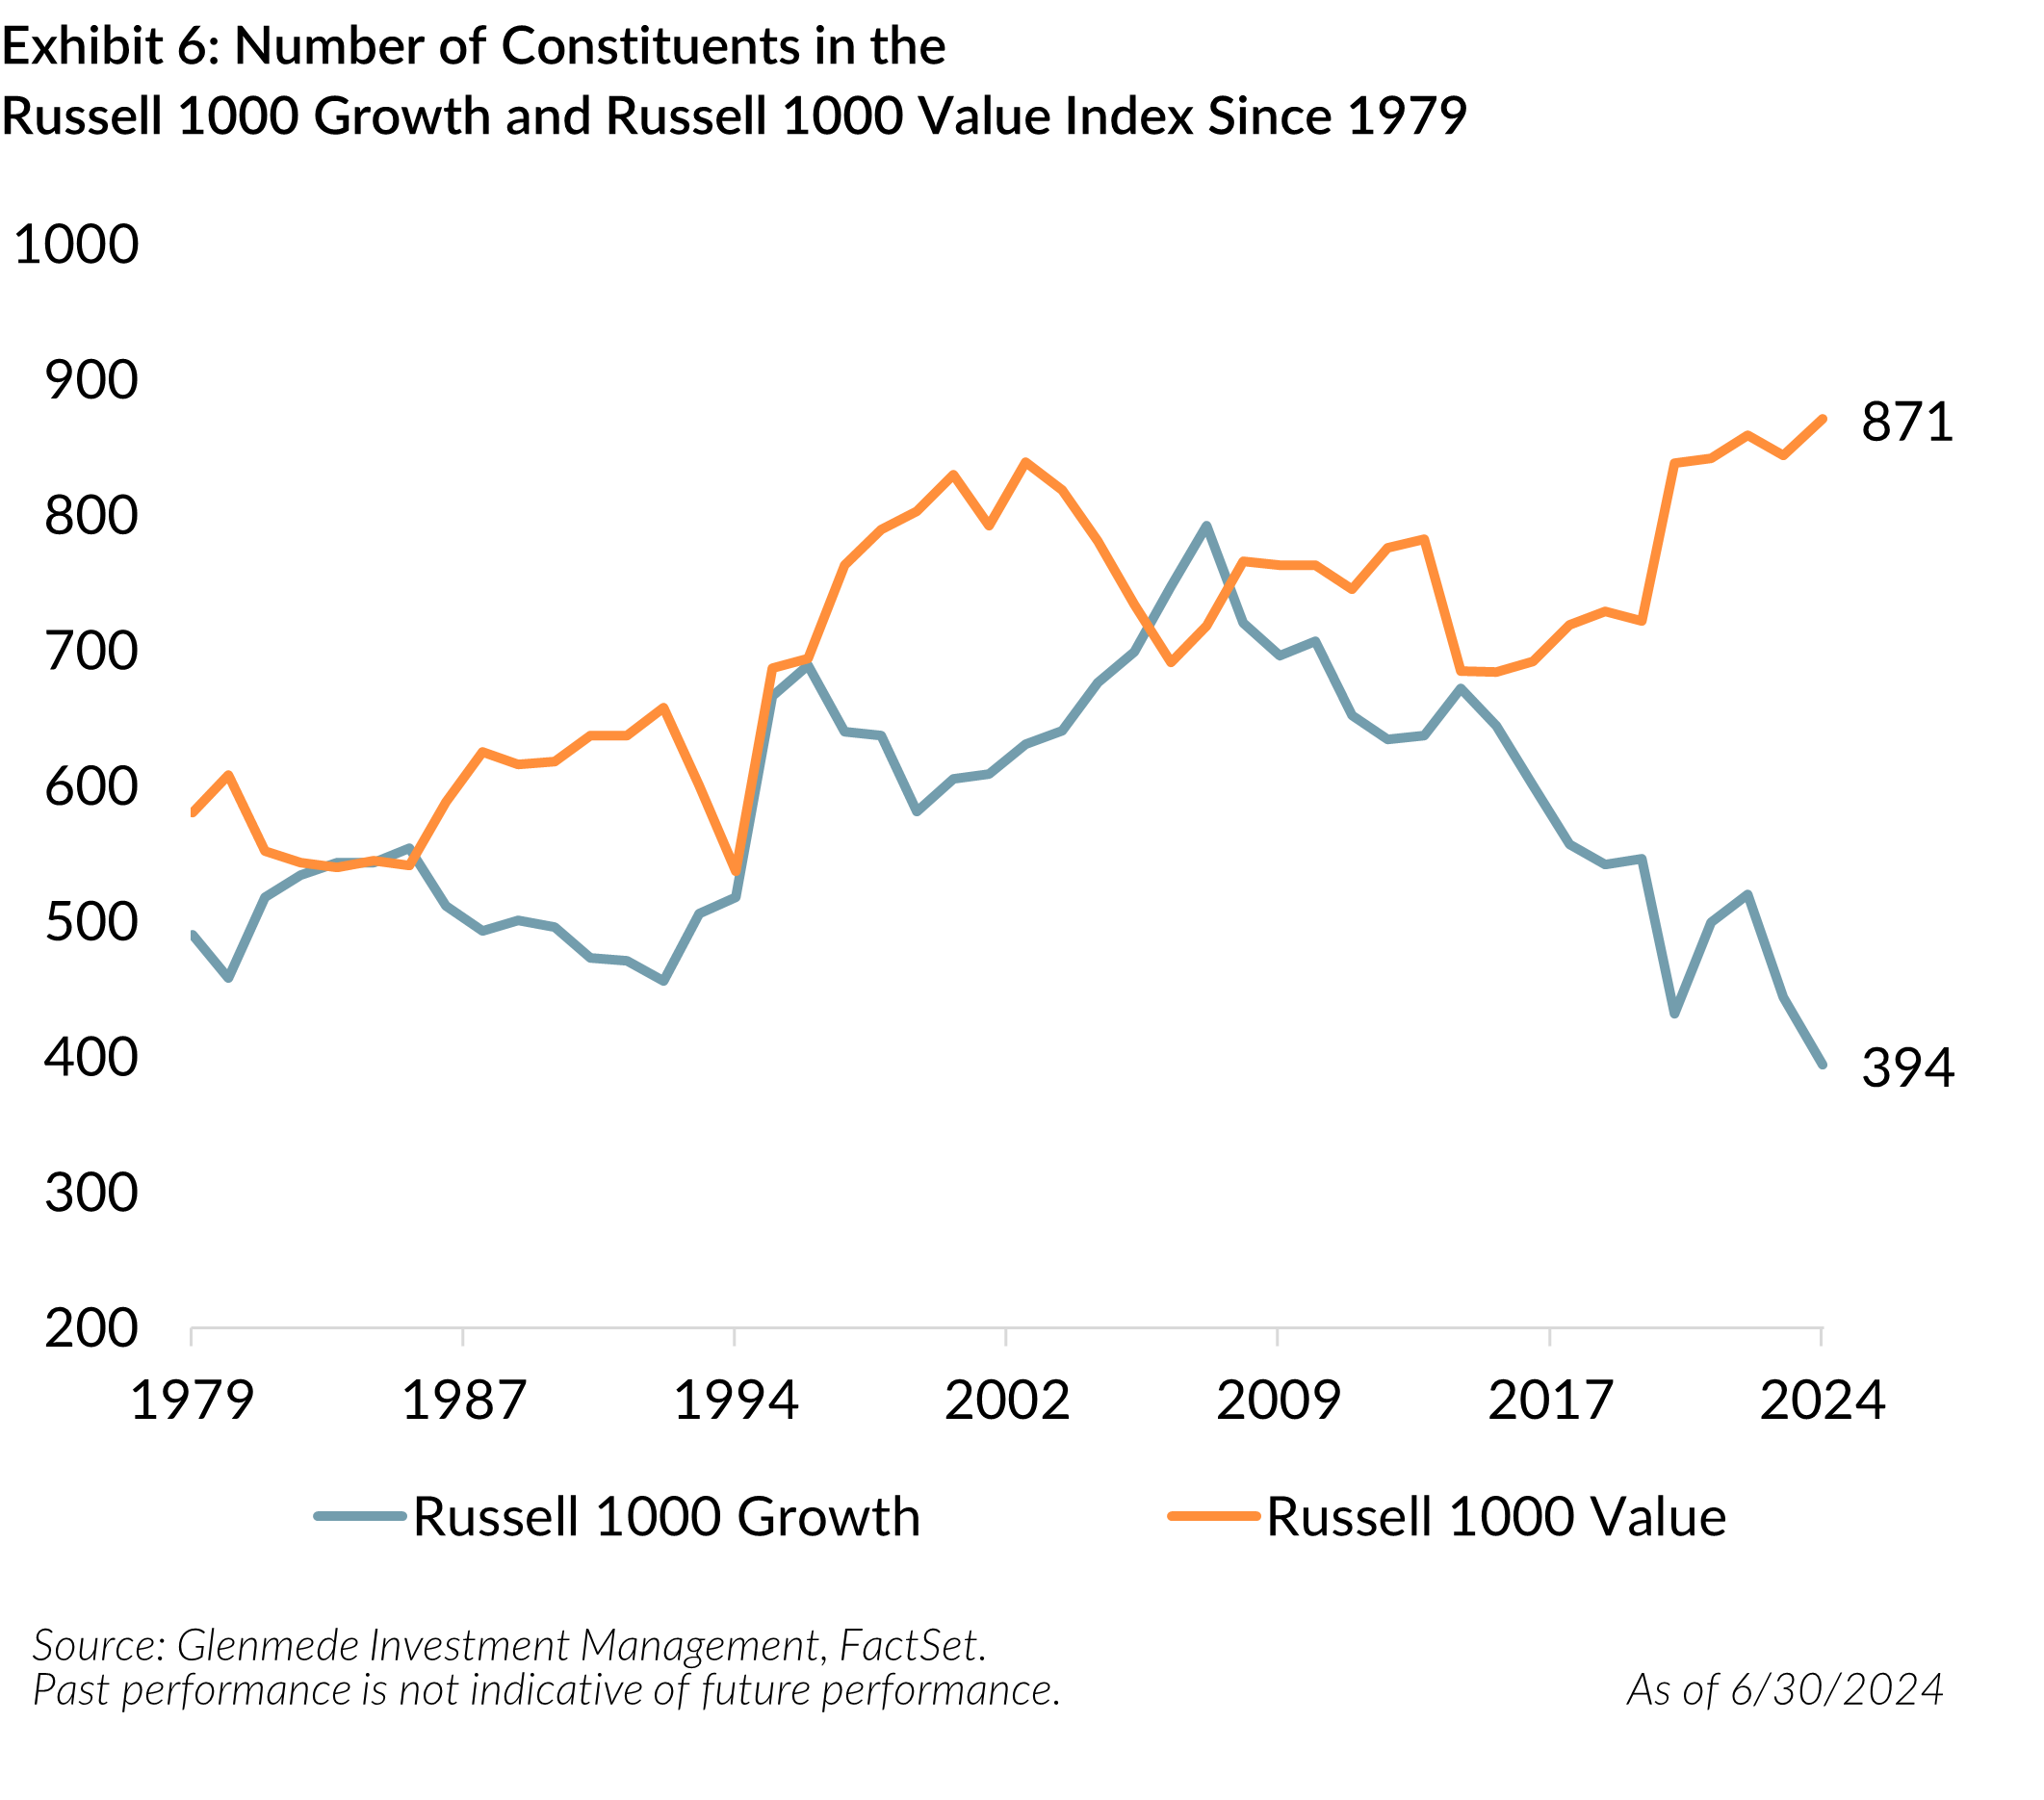
Exhibit 6 shows the constituent changes of the Russell 1000 Growth Index and Russell 1000 Value Index since 1979.
Concern: For investors with a growth tilt, concentration is even more extreme in passive U.S. large cap growth indices, offering the least amount of diversification in its history. Following its June 28, 2024, rebalance, the Russell 1000 Growth Index became less diversified than ever, with constituents decreasing from 440 to 394, while the Russell 1000 Value Index increased from 846 to 871 holdings (record high). The top 10 weights of the Russell 1000 Growth Index comprise 61.0% of the index, compared to the Russell 1000 Value Index at 17.2%.
7. Russell 1000 Growth Index is Now Less Diversified than Nasdaq 100 Index
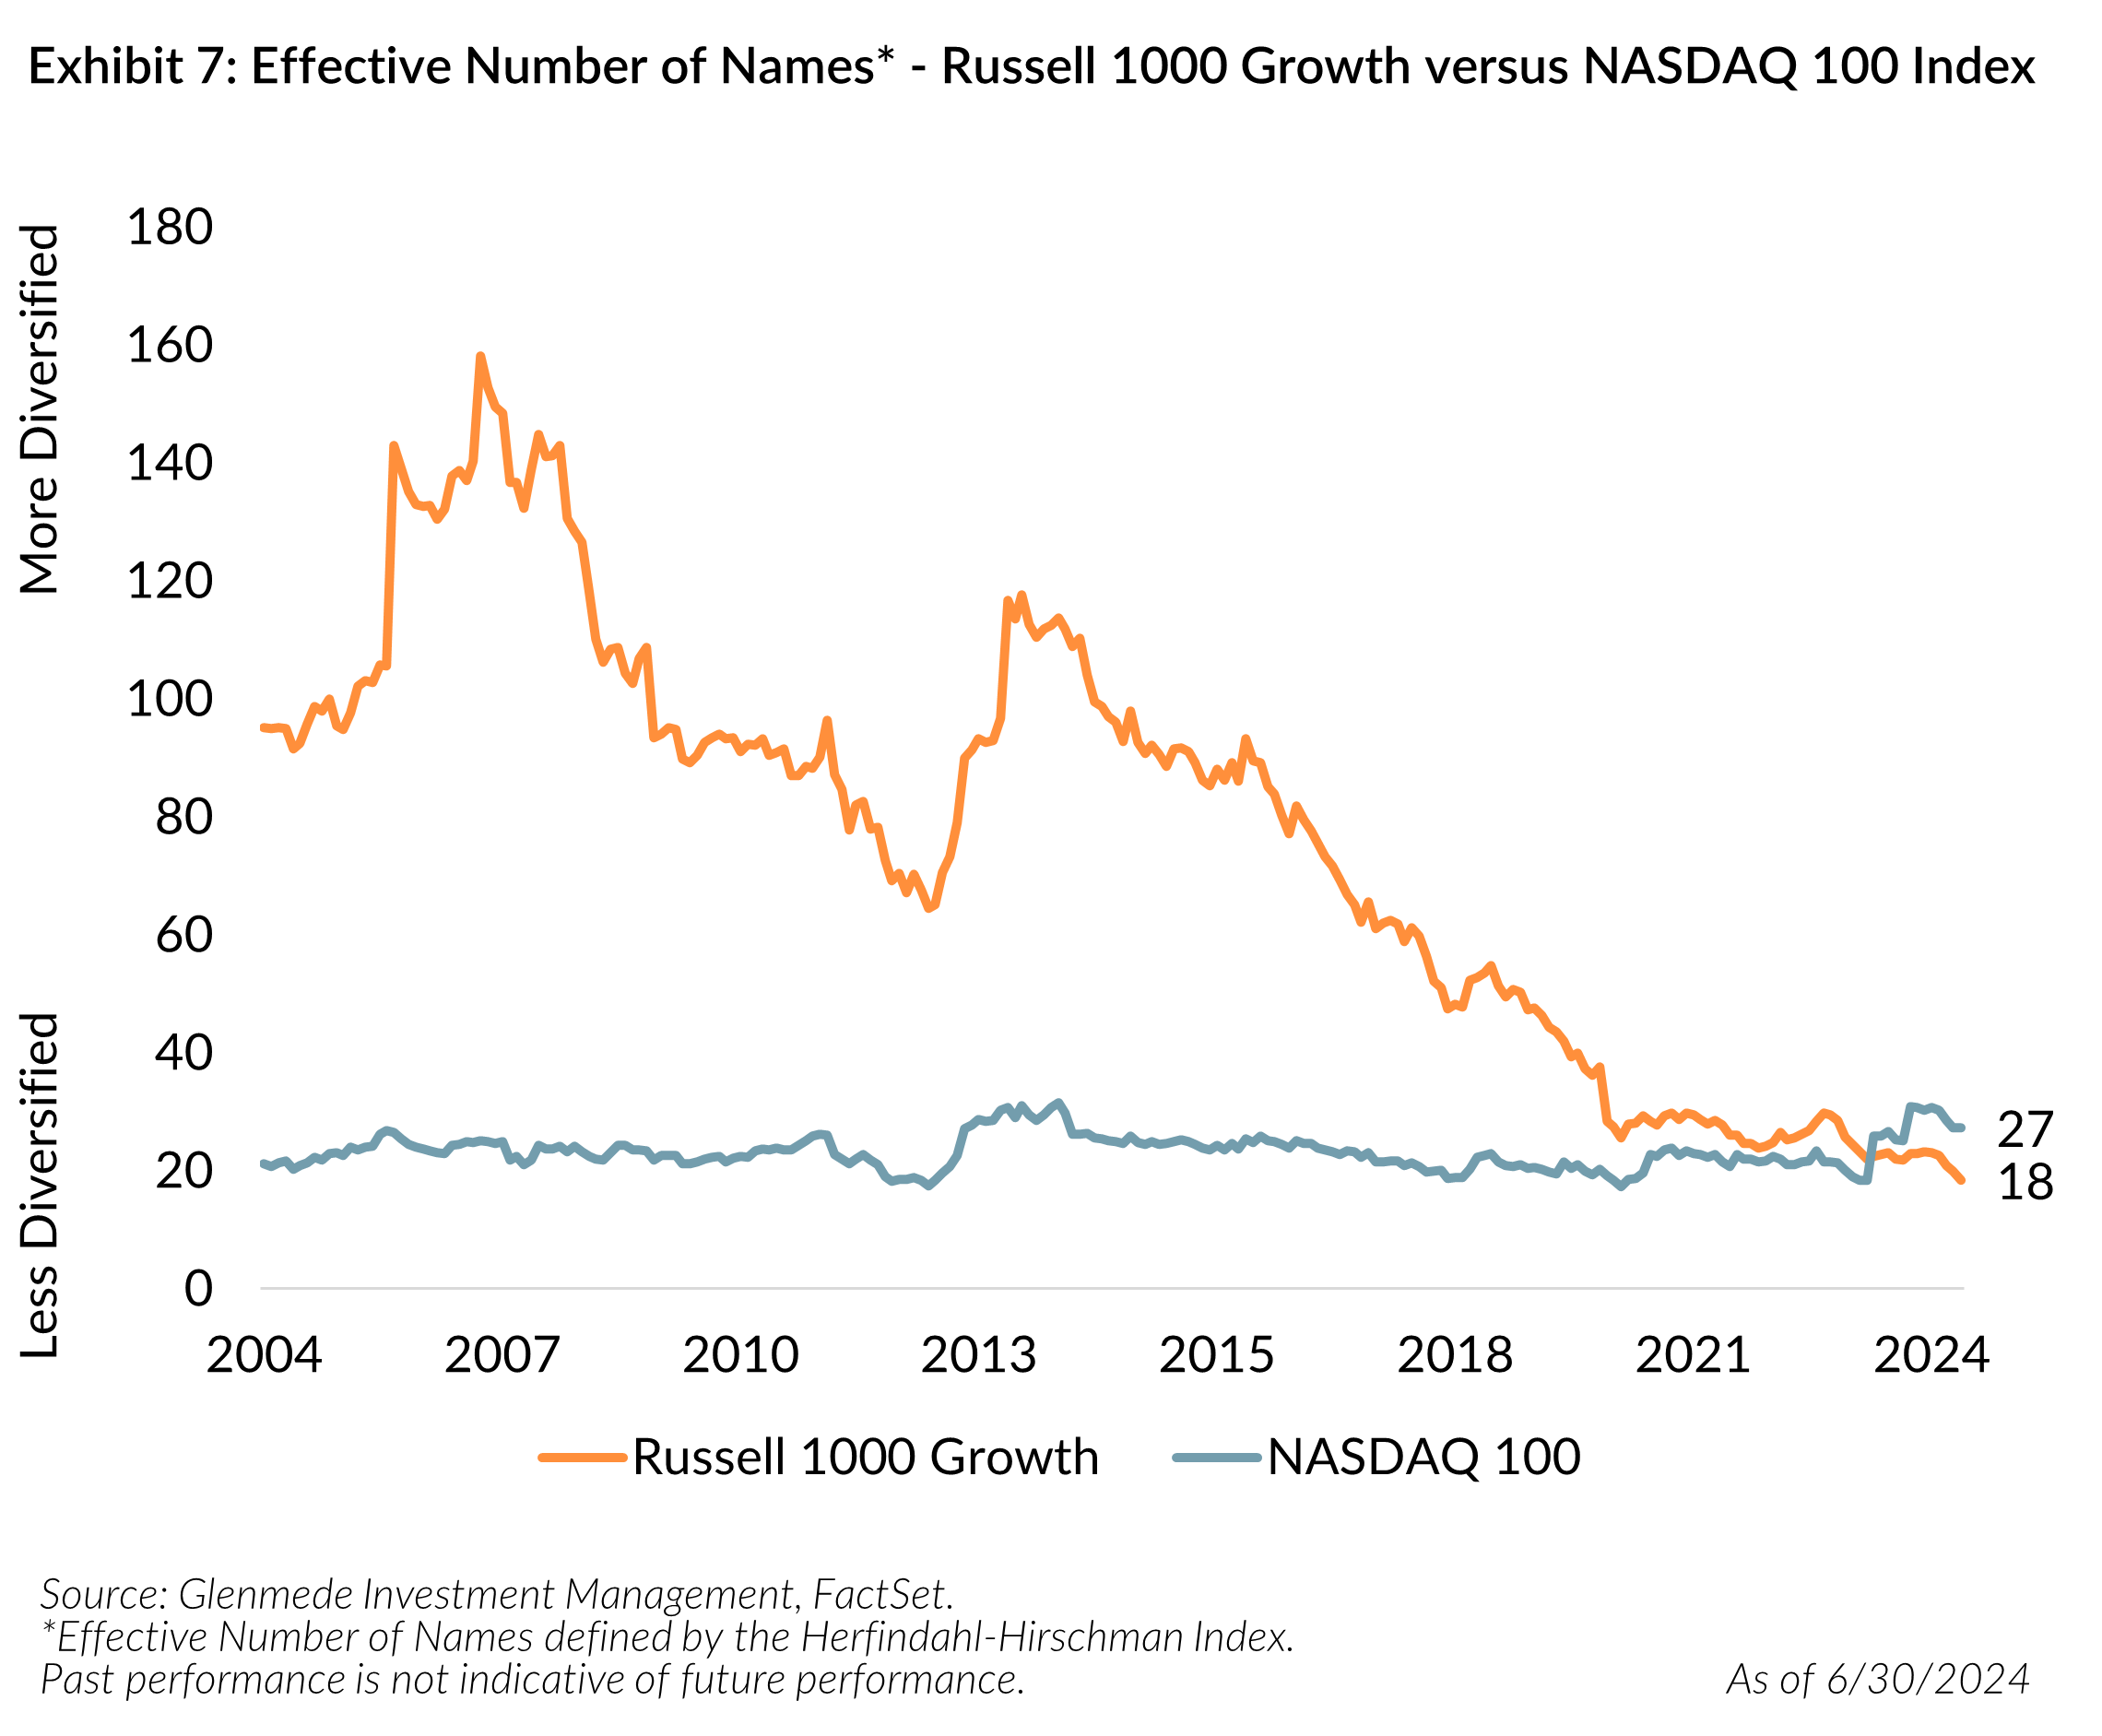
Exhibit 7 shows the effective number of names for the past 20 years using the Herfindahl-Hirschman Index8 (HHI) for the Russell 1000 Growth Index versus the Nasdaq 100 Index.
Concern: The effective number of names using the Herfindahl-Hirschman Index (HHI) is the lowest on record (data since 1979) for the Russell 1000 Growth Index at just 18. In other words, the Russell 1000 Growth Index has similar “diversification” characteristics to a concentrated portfolio of only 18 stocks. This is half of the level we saw in the peak of the dotcom bubble (HHI was 36 in May 2001). The average since 1979 is 73.
Exhibit 7 reflects the dramatic increase in concentration (or decrease in diversification via HHI calculations) of the Russell 1000 Growth over the past 20 years. The NASDAQ 100, with many fewer constituents, has, not surprisingly, generally been on average more concentrated than the Russell 1000 Growth when measured by HHI. Interestingly, following the NASDAQ 100 special rebalance9 last year which capped some of the exposure to the mega cap tech names to adjust for some of the concentration and the most recent Russell rebalance, that situation has reversed10. The NASDAQ 100 has become more diverse with an HHI of about 27 (Q2 2023 HHI of 18).
Increased concentration exemplifies a concern we have noted several times with the structure of market-cap weighted indices; no matter their ability to reflect the broader stock market over time, where increasing stock price increases market cap resulting in an increased index weighting, the result is a less diversified and unrealistic “top heavy” market measure.
We believe that mean reversion is a starting point to the conversation, but also firmly believe that starting points of valuation matter to future returns. Given the current discount of small cap relative to large in both the Russell and S&P indices, we believe the risk/reward to small cap remains attractive. We continue to prefer strategies that have a higher quality bias with a focus on profitability.
Opportunities to Diversify
With fewer holdings in the Russell 1000 Growth Index, concentration risk increases. We believe there is an opportunity to diversify away from some of the continuing concentration risk by allocating a portion of large cap growth exposure to active strategies with single name exposure limits, to create a more complete strategy that works through a full market cycle. While the concentrated Russell 1000 Growth may continue to outperform in the near term, risks are real, and we believe actively managed large cap growth strategies are more compelling in that scenario.
Similarly, for those focusing instead on the S&P 500, diversifying some passive index exposure to active large cap managers with a focus on valuations is an attractive way to help manage concentration and the potential unrealistic expectations for growth based on shares of current profits and sales.
Outside of U.S. large cap blend and growth, we continue to favor U.S. small cap blend, as noted previously11.
THE QUARTERLY STATEMENT
is a Glenmede Investment Management LP newsletter written in collaboration with the investment teams and Stacey Gilbert, Chief Investment Officer/Portfolio Manager, Derivatives.
 March 24, 2025
Market Snapshot: Tariffs and Tantrums and Trade, Oh My!
On March 13, 2025, the S&P 500 entered correction territory, closing ~10% lower than its all-time high. Since 1927, intra-year declines of 10% or more occurred in …
 March 13, 2025
Market Snapshot: Earnings Surprises—Mag 7 Approaching Lag 7
Positive earnings surprises for the Magnificent Seven have been more in line with the broader S&P 500 index this year relative to last year, suggesting that expectations …
1 Positive returns in Information Technology, Communication Services, Utilities, Consumer Staples, Consumer Discretionary
2 For more reading our on perspective of higher quality small cap, please see the following Quarterly Statements – Q1 2024, Q4 2023 and Q3 2023.
3 In 1964, GM, Exxon, Texaco, IBM, and AT&T made up 27.7% of the S&P 500.
4 https://www.morningstar.com/funds/recovery-us-fund-flows-was-weak-2023
5 We acknowledge that some Fortune 500 companies are not publicly traded, and the trend for companies to remain private much longer than previous periods could contribute to some of these differences.
6 All NYSE, AMEX and NASDAQ stocks for which the authors could obtain data. Further detail regarding these metrics available at https://mba.tuck.dartmouth.edu/pages/faculty/ken.french/data_library.html
7 Top decile sales are 52% of U.S. GDP versus 45% in 1999 and 25% in 1964 (note we do not have 1928 data). Top decile profits are 4.8% of U.S. GDP versus 2.7% in 1999 and 1.7% in 1964 (note we do not have 1928 data).
8 The Herfindahl-Hirschman Index (HHI) is a common measure of market concentration. The HHI is calculated by squaring the market share of each firm, and the “effective number of names” in an index is using the reciprocal of HHI. Please see Russell Rebalancing Into More Concentrated Growth for additional information on the effective number of names,
9 https://ir.nasdaq.com/news-releases/news-release-details/nasdaq-100-index-special-rebalance-be-effective-july-24-2023
10 The NASDAQ 100 is actually more diverse (Q2 2023 HHI was 18 compared to its current 27) while the Russell 1000 Growth Index is more concentrated (Q2 2023 HHI was 22 compared to its current 18). In fact, following the special rebalance, the NASDAQ 100 is now above its 20-year HHI average value of 23.
11 For more reading our on perspective of higher quality small cap, please see please see the following Quarterly Statements – Q1 2024, Q4 2023 and Q3 2023.
All data is as of 6/30/2024 unless otherwise noted. Opinions represent those of Glenmede Investment Management LP (GIM) as of the date of this report and are for general informational purposes only. This document is intended for sophisticated, institutional investors only and is not intended to predict or guarantee the future performance of any individual security, market sector or the markets generally. GIM’s opinions may change at any time without notice to you. Any opinions, expectations or projections expressed herein are based on information available at the time of publication and may change thereafter, and actual future developments or outcomes (including performance) may differ materially from any opinions, expectations or projections expressed herein due to various risks and uncertainties. Information obtained from third parties, including any source identified herein, is assumed to be reliable, but accuracy cannot be assured. This paper represents the view of its authors as of the date it was produced, and may change without notice. There can be no assurance that the same factors would result in the same decisions being made in the future. In addition, the views are not intended as a recommendation of any security, sector or product. Returns reported represent past performance and are not indicative of future results. All results reported are of unmanaged indices, used just as illustrations for various market segments. These do not reflect what an actual investment in this sector would achieve, as it includes no accounting for trading costs or fees. Performance of any particular investment in one of these market segments could be lower or higher than what is reflected above.