The Quarterly Statement Q4 2024: Concentration ’24 and a Look Ahead
Market Review: Fourth Quarter 2024
 What We Know: Q4 2024 Recap
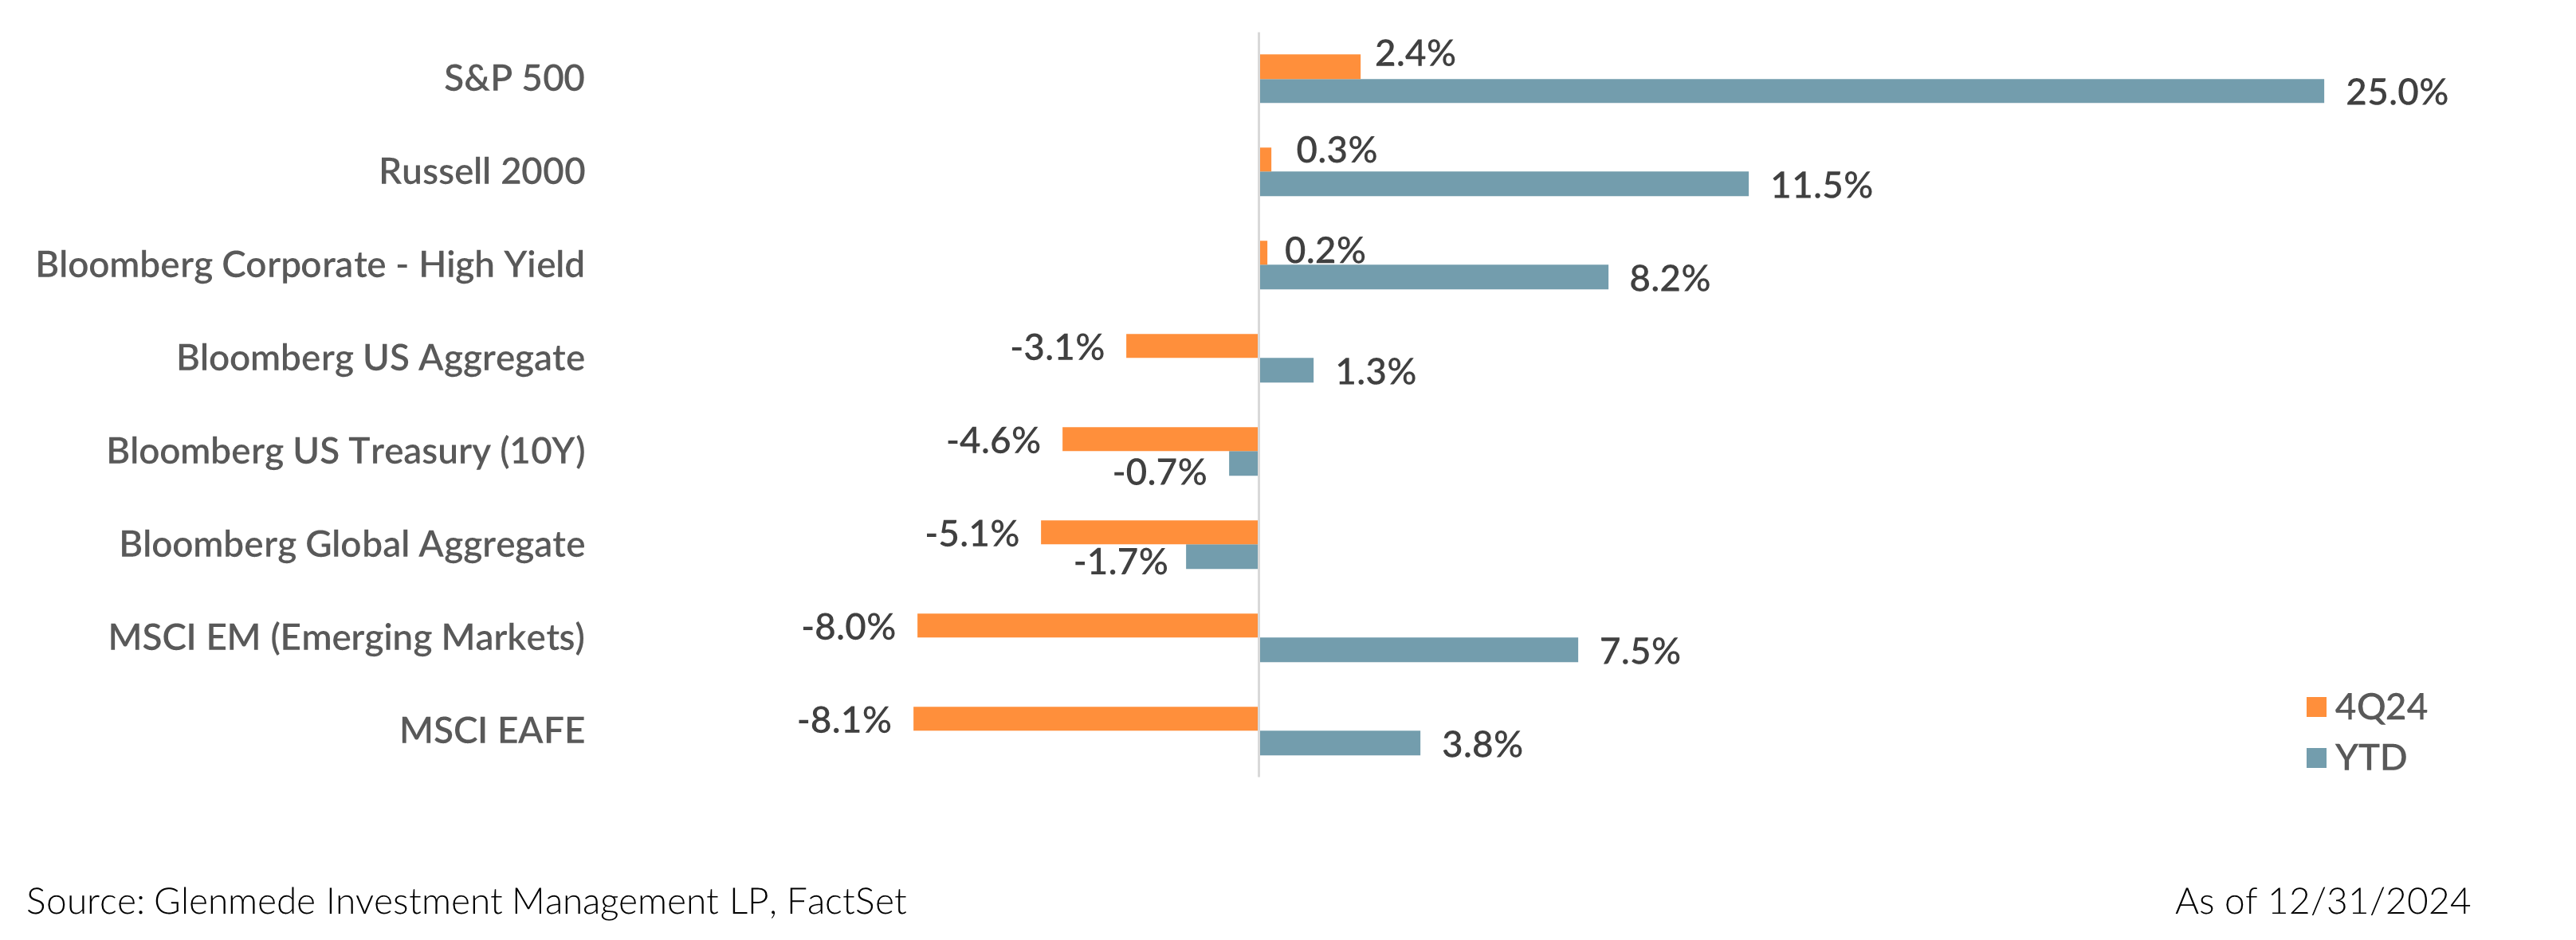
The S&P 500 Index saw its fifth straight quarter of positive returns, finishing Q4 2024 with a 2.4% rally and 25.0% return on the year. The broadening market participation of Q3 2024 narrowed back, mostly, to the mega cap growth stocks by year end. The NASDAQ 100 outperformed the S&P 500 Index for the quarter (4.9% versus 2.4%, respectively) and outperformed slightly on the year (25.9% versus 25.0%, respectively). The S&P 500 Equal Weight Index saw a negative 1.9% return for the quarter. On the year, the S&P 500 Index has practically doubled the performance of the S&P 500 Equal Weight Index (25.0% versus 13.0%, respectively). These back-to-back years of the S&P 500 Index almost doubling the performance of the S&P 500 Equal Weight Index (29.2% cumulative 12.2% average annualized) is the greatest two-year underperformance gap of market cap versus equal weight in over 24 years (the previous period was Q1 2000).
With the continued strong performance of the “Magnificent Seven” mega cap growth stocks (Apple Inc., Microsoft Corporation, Alphabet Inc., Amazon.com, Inc., NVIDIA Corporation, Meta Platforms, Inc. and Tesla, Inc.), growth (Russell 1000 Growth Index) resumed its outperformance relative to value (Russell 1000 Value Index) this quarter with value experiencing a 2.0% drawdown, versus growth rallying 7.1%. On the year, growth has outperformed value by almost 2.5 times (33.4% versus 14.4%, respectively). Since the start of 2023, value has underperformed growth by a cumulative 62.9% (25.0% average annualized return). This is the greatest two-year underperformance of value to growth since the start of data in 1979. While past performance is never a guarantee of future returns, in the previous two observations when growth outperformed value by more than 60.0% cumulative in the previous two years, value outperformed growth over the next 12 months, with an average outperformance of 36.6%.1
Sector returns of the S&P 500 Index finished mixed, with Consumer Discretionary as the sector winner, rallying 14.3% on the quarter and 30.1% for the year. Communication Services was the runner-up rally winner for the quarter with an 8.9% return but took the top prize for the year with a return of 40.2%. Materials was the sector laggard for the quarter with a drawdown of 12.4% and flat on the year.
After a strong rally following U.S. elections, small caps returned to underperforming large caps this quarter (Russell 2000 returned 0.3% versus S&P 500 rally of 2.4%). For 2024, large cap more than doubled the small cap return (25.0% versus 11.5%, respectively). Over the past two years, small cap has underperformed large cap by 27.5% cumulative (11.4% average annualized) – the worst two calendar year performance gap for small cap since December 1999. We continue to believe there is an attractive risk/reward opportunity for higher-quality small caps.2
International markets fared poorly this quarter with Emerging Markets (MSCI Emerging Markets Index) declining 8% and Developed International (MSCI EAFE Index) declining 8.1%. In fact, international markets lagged the domestic markets for this entire year (MSCI Emerging Markets Index 8.0%, MSCI EAFE Index 4.4% versus S&P 500 Index 25.0%).
The Federal Reserve kicked off a new easing cycle in Q3 2024 and continued to ease with two additional 25 basis point cuts in Q4 2024. These cuts resulted in the Fed Funds rate being a full percentage point lower than at the start of the year, easing some of the concerns and economic pressures of higher rates. Market expectations continue to price in two more cuts in 2025, although Fed rhetoric has shifted to a less aggressive rate-cutting stance as it closely watches inflation. The U.S. Treasury curve continued to steepen this quarter, finishing the year at levels not seen since Q2 2022, prior to the curve inversion. This spread is a much-watched recessionary indicator, and had been inverted since mid-2022 but finished Q4 2024 up by 33 basis points, a far cry from the more than 100 basis point inversion experienced in Q3 2023.
What We Debate: A Practitioner’s Perspective – Concentration ’24 and a Look Ahead
“HISTORY DOESN’T REPEAT ITSELF, BUT IT OFTEN RHYMES.”
– Mark Twain
While there were many stories that impacted the broader financial markets in 2024 (Central Bank policies, elections, geopolitics, strong U.S. economic data relative to other developed markets, and sticky inflation, to name a few), the increase in market concentration across most broad-based U.S. indices remains the most persistent. We highlight the continued increase in concentration in the charts below.
Concentration ’24!
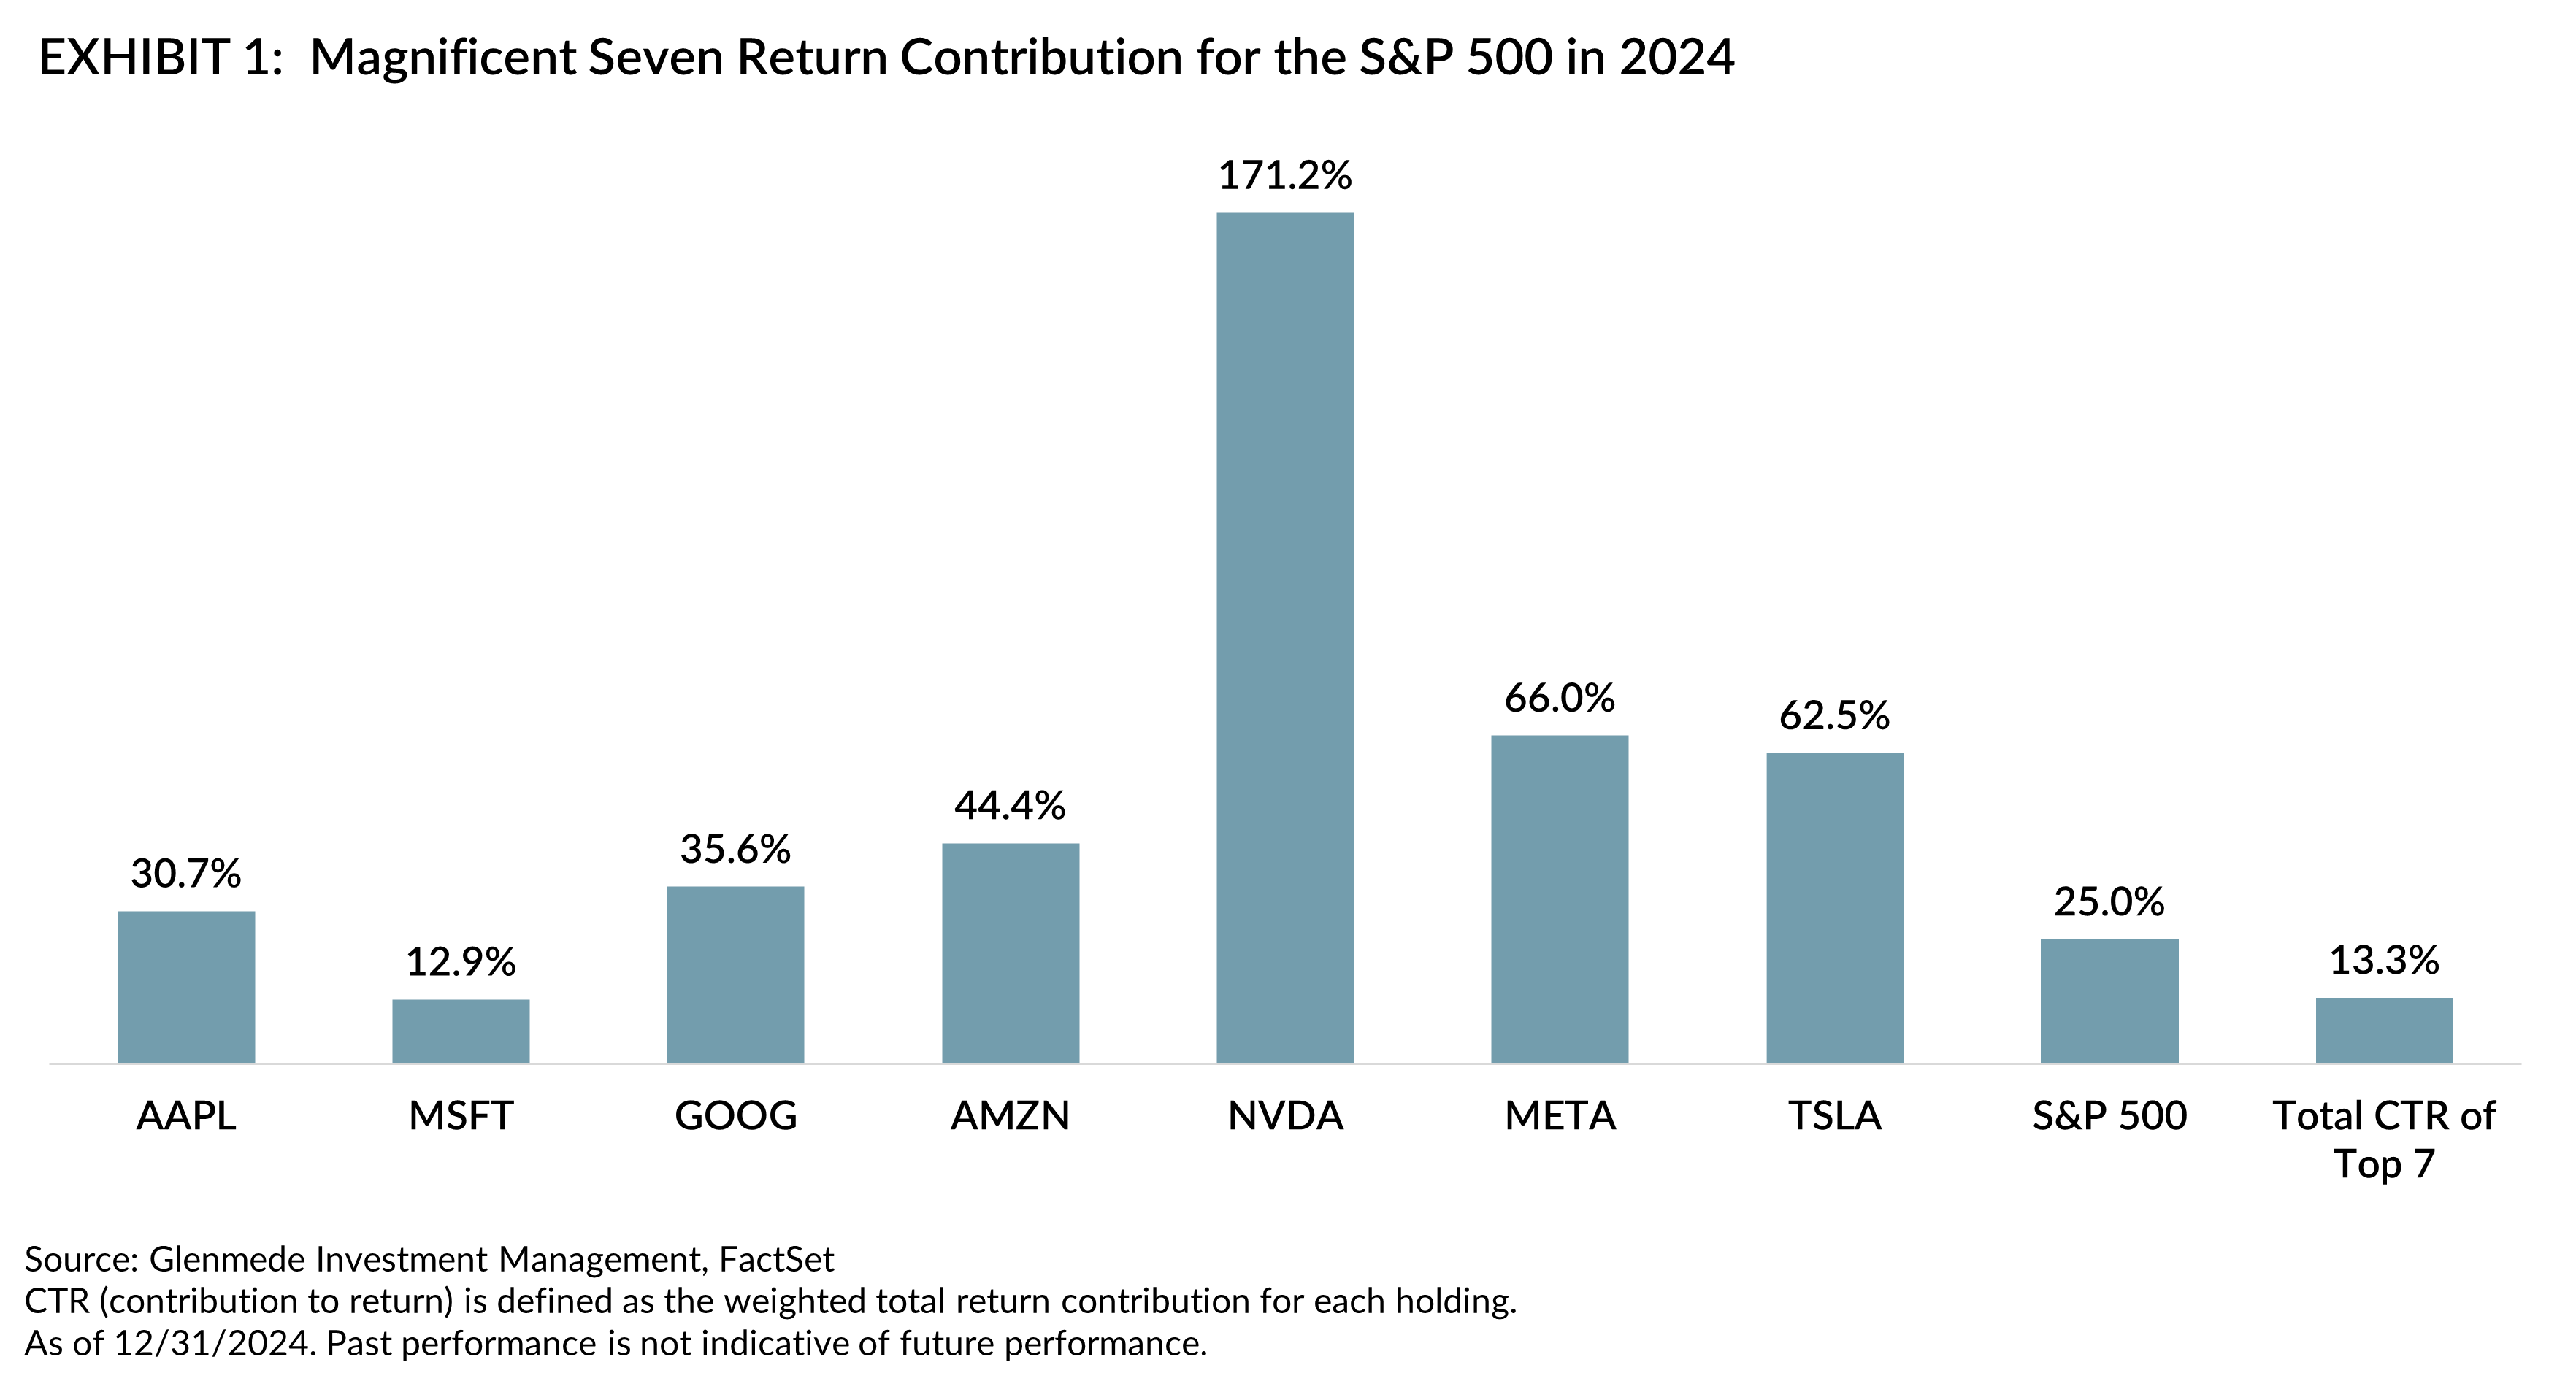
While there were periods of broader participation in the market rally this year, the “Magnificent Seven” continued to be the driving force of broader market returns for indices like the S&P 500 Index. As shown in Exhibit 1, more than 50% of the S&P 500 annual total return of 25.0% came from these seven mega cap growth stocks, with NVIDIA alone contributing almost 25% of the total return for the year. While there were periods of broader participation in the market rally this year, the “Magnificent Seven” continued to be the driving force of broader market returns for indices like the S&P 500 Index. As shown in Exhibit 1, more than 50% of the S&P 500 annual total return of 25.0% came from these seven mega cap growth stocks, with NVIDIA alone contributing almost 25% of the total return for the year.
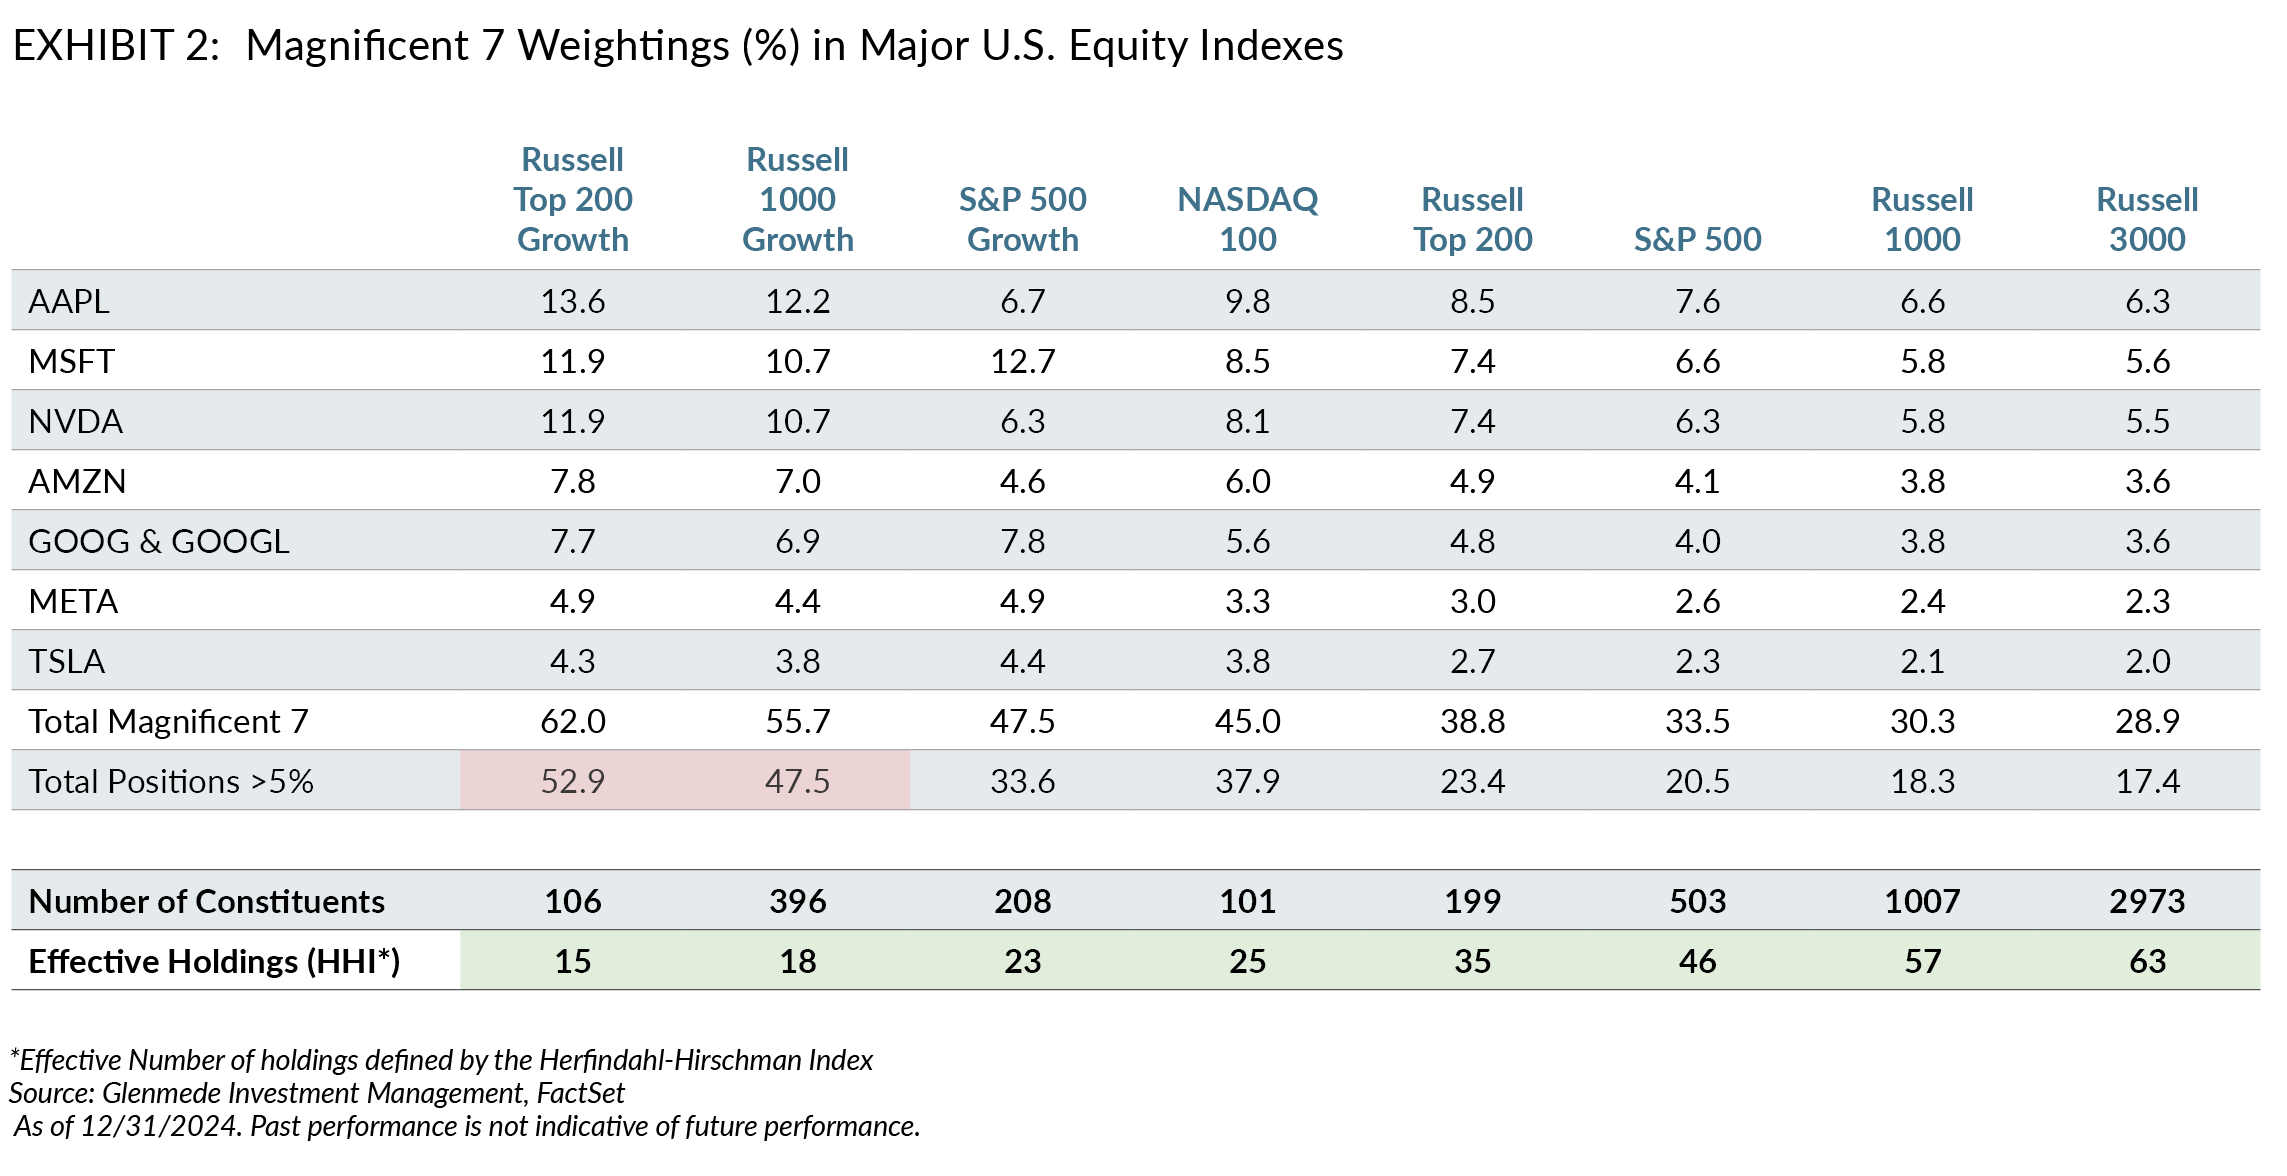
As the Magnificent Seven continued to rally, their combined weights in the indices, marketed as diversified baskets of stocks, only increased. As shown in Exhibit 2, concentrations of the seven in several broad-based S&P and Russell indices range from 62% of the Russell Top 200 Growth Index weight to almost 29% of the Russell 3000 Index. Concentration is the opposite of diversification and continued concentration was true for many typical benchmarks.
For example, as also seen in Exhibit 2, we calculate the “effective number” of names in an index using the Herfindahl-Hirschman Index (HHI)3 measuring concentration. Historically diversified broad-based indices of the S&P 500 and the Russell 1000 currently reflect extremely low diversification levels (S&P 500 Index is 46 names versus 20-year average of 114 and Russell 1000 Index is 57 names versus 20-year average of 144). The Russell 1000 Growth Index has some of the most extreme concentration – or lack of diversification – with the effective number of names at just 18, versus the 20-year average of 76. Indexes were just not so diversified in 2024.
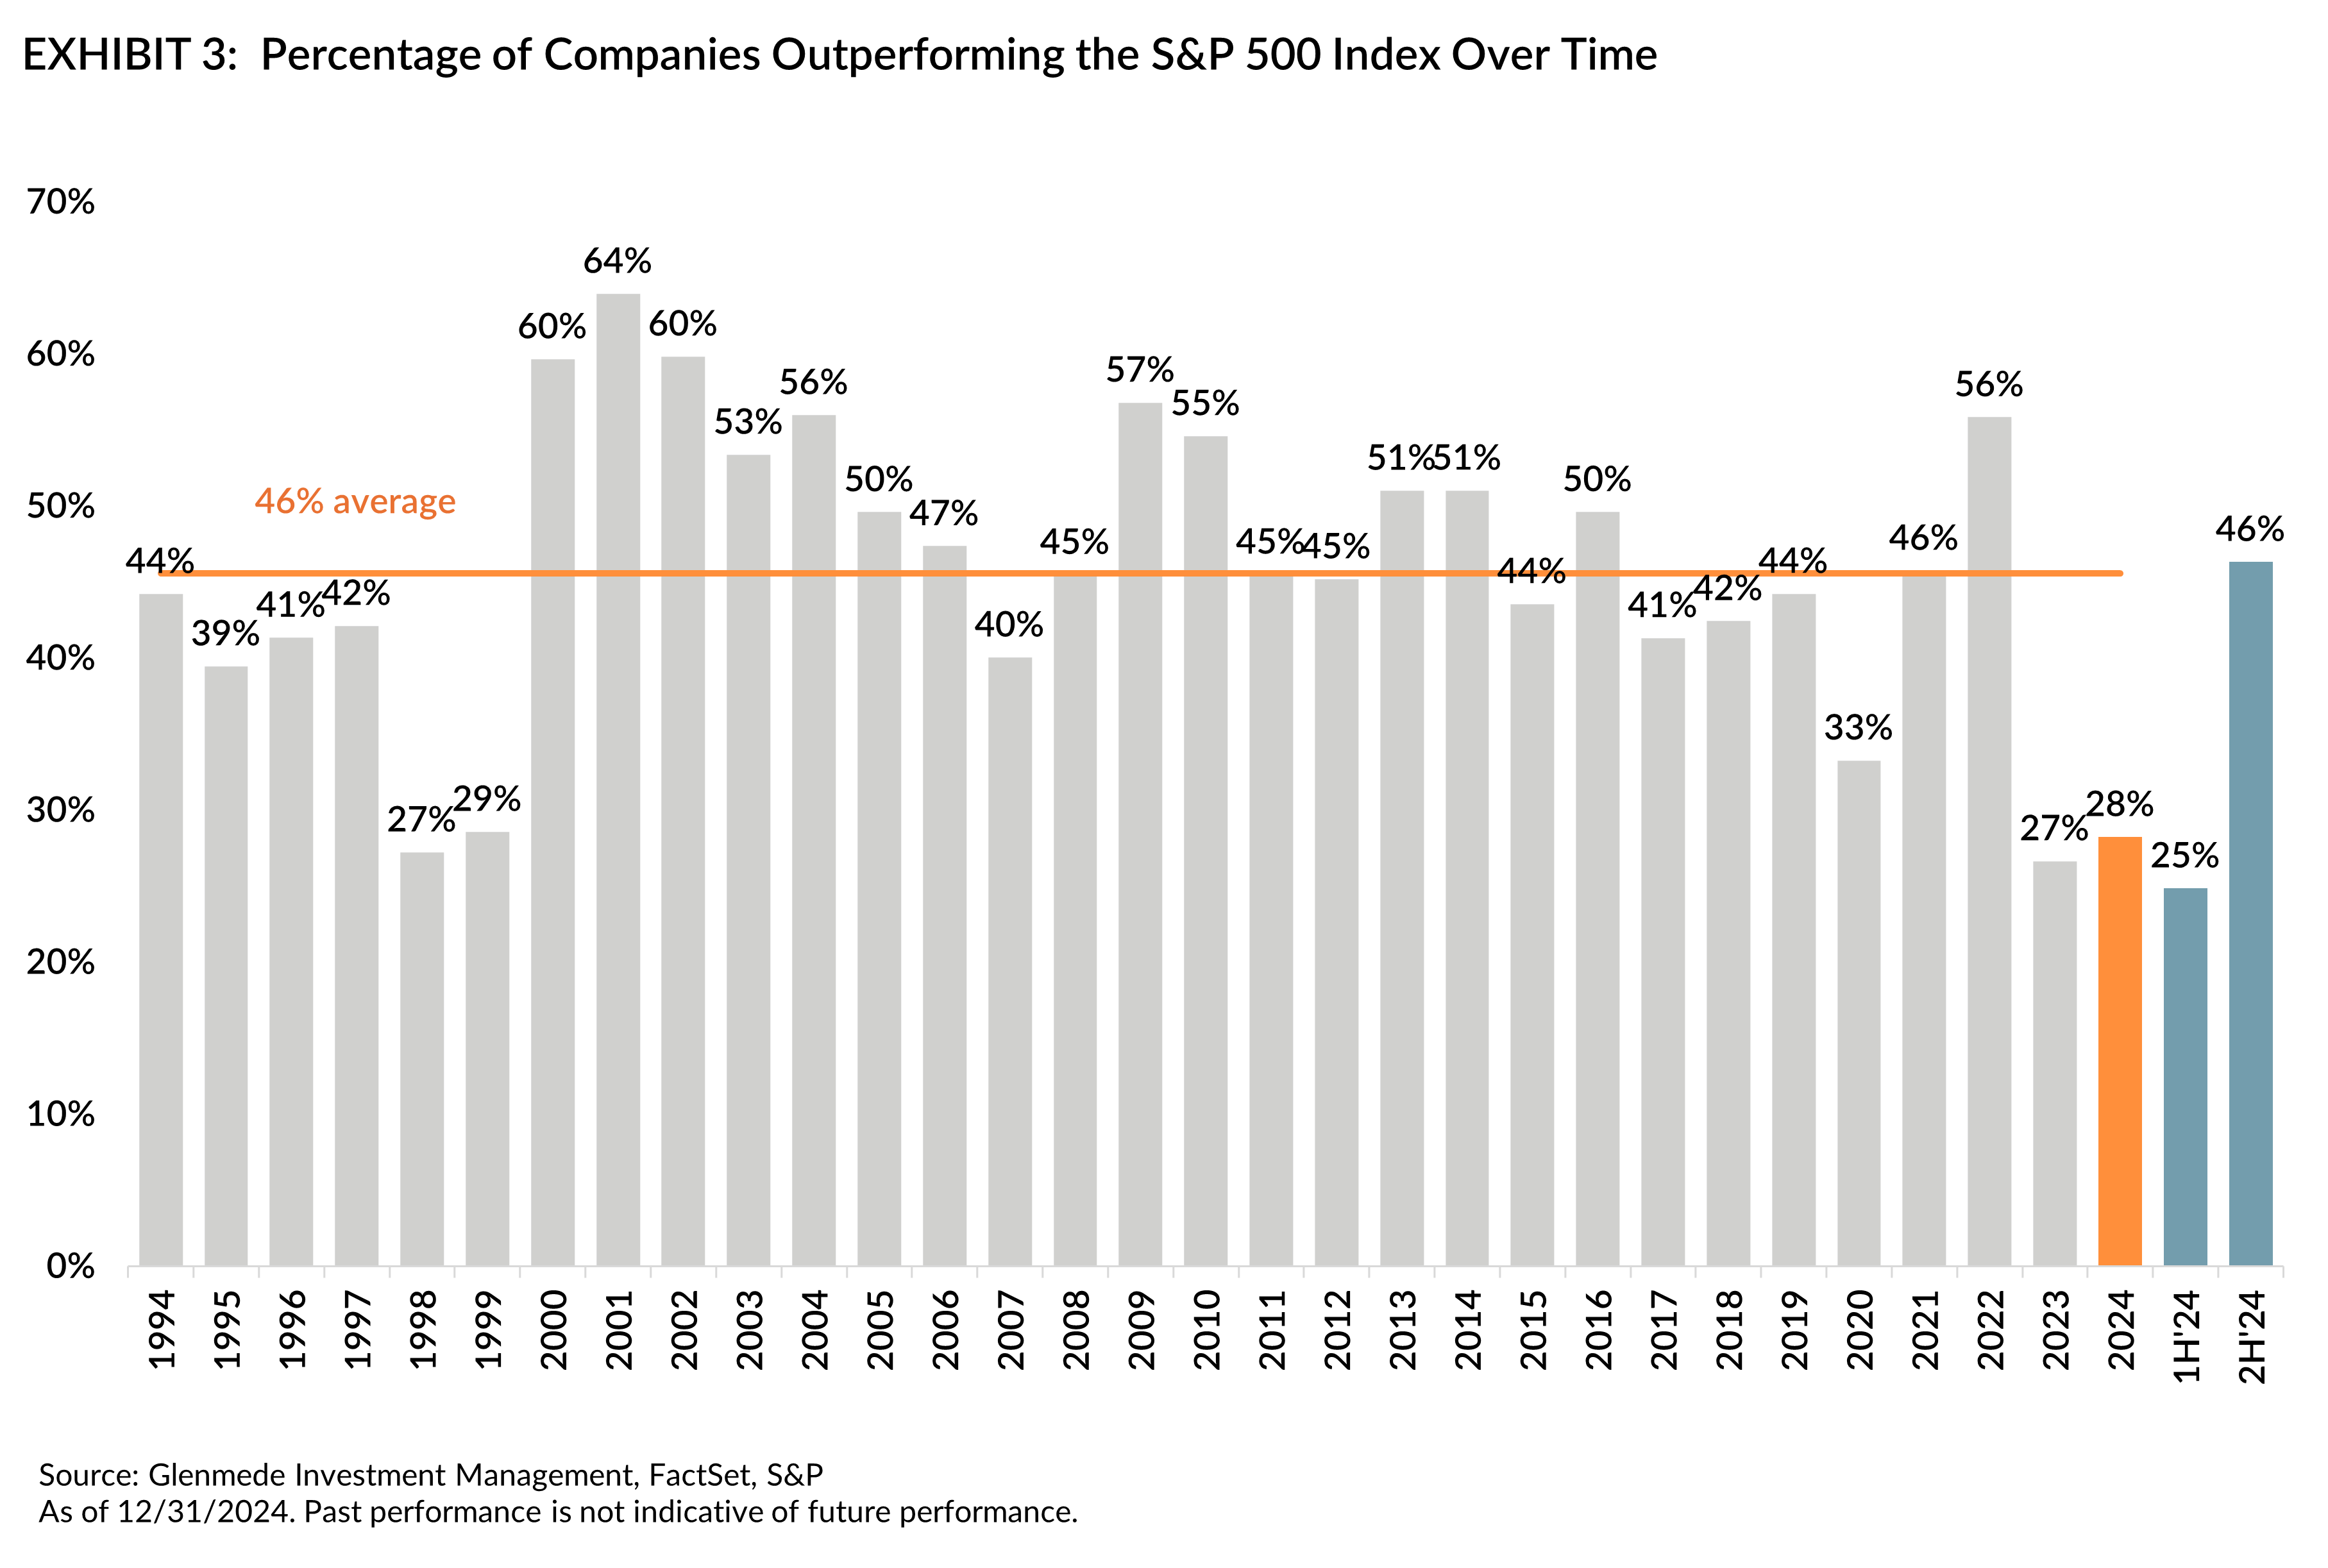
While U.S. market concentration remains high, index participation remains near historic lows. Exhibit 3 shows the percentage of S&P 500 companies outperforming that index since 1994. While 2023 tied 1998 for the least participants on record at just 27% of constituents outperforming, 2024 was only a slight tick up to 28%, well below the 30-year average of 46% (annualized). Part of that miniscule improvement this year was a better second half participation, but that was not enough to overcome the leadership of the Magnificent Seven driving S&P 500 Index returns for most of 2024.
While we acknowledge that the Magnificent Seven could continue to outperform and propel indices to short-term returns, we believe diversifying away from U.S. large cap passive strategies and their historic concentration risk is prudent. We believe diversification remains a central element of robust portfolio construction and that actively managed, genuinely diversified large cap strategies with limits on individual stock exposures can help ameliorate the risks in a large cap allocation through a full market cycle.
A Look Ahead to 2025
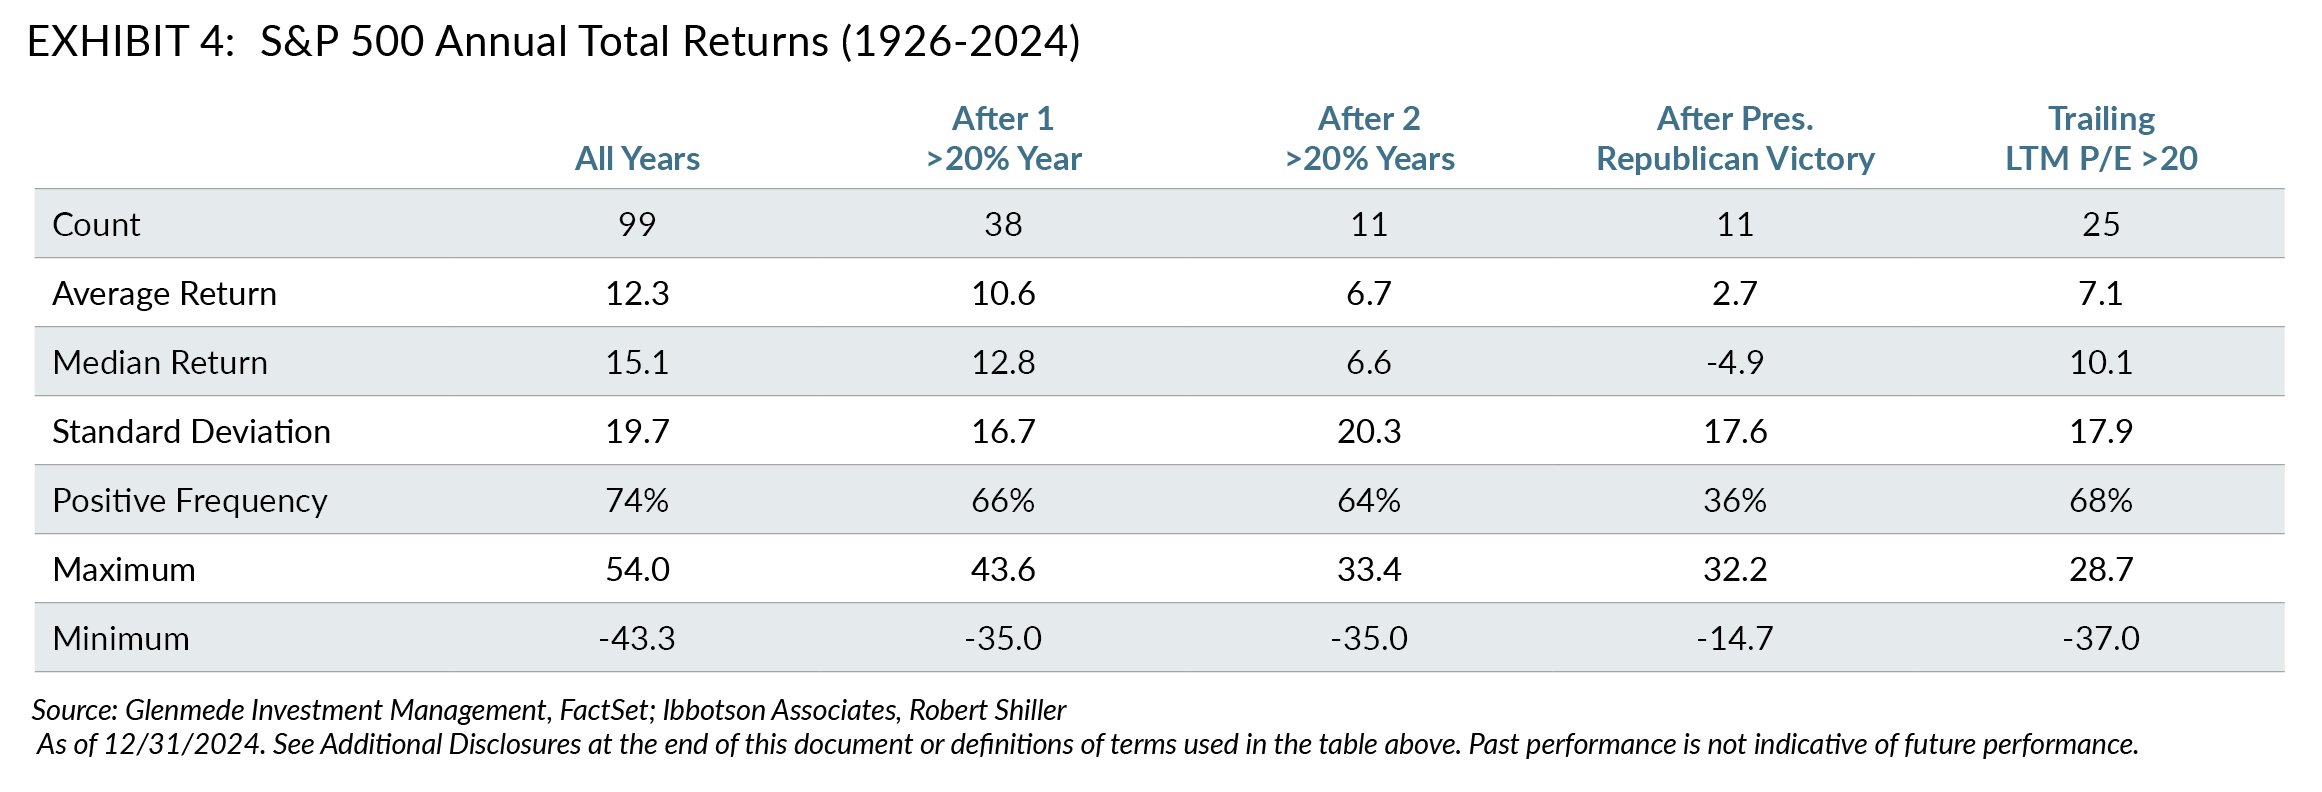
To paraphrase Mark Twain (and stay in the good graces of compliance), history can rhyme. Past performance may not dictate future results but understanding how markets have reacted in similar periods can inform thinking about possible future outcomes. Given back-to-back >20% returns of the S&P 500, not seen since the dotcom days, we wanted to get a historical perspective on similar environments. While returns certainly matter, other influences like economic conditions and starting valuations can also be important determinants of returns. Exhibit 4 looks at the total returns of the S&P 500 since 1926. We compare the average returns, positive frequency and ranges of moves over the next 12 months with back-to-back >20% rallies, Republican presidential victories and valuation levels of last-12-month (LTM) price-to-earnings ratios (P/E).
Back-to-Back >20% Returns
U.S. equity markets have been in a bull market rally for the past two years. Since its October 12, 2022 low, the S&P 500 Index has experienced a cumulative total return of 70.1% (27.0% average annualized). Of the past 99 years of S&P 500 total return observations, as shown in Exhibit 4, only 11 observations have seen years of back-to-back >20% returns. Historically, the median return over the next 12 months was significantly more muted at 6.6% with a range of +33.4% to a drawdown of 35.0%. Volatility crept up a touch from the average of all years of 19.7 to 20.3 in the year following back-to-back >20% returns and the index saw positive returns 64% of the time.
While the median return following back-to-back >20% years is 6.6%, the last time the S&P 500 saw back-to-back >20% rallies was in the 1990s, but 1995-1999 saw five consecutive 20%+ years, so at least once the trend lasted longer.
Republican Presidential Wins
Broader market volatility as measured by the CBOE Volatility Index (VIX) declined when a clear winner of the 2024 U.S. Elections was decided on election night. Donald Trump joined Grover Cleveland as only the second president in U.S. history to be elected to non-consecutive terms. Republicans won control of the Senate, although well-short of the 60-vote threshold needed for a filibuster. The GOP also maintained control of the House of Representatives. U.S. markets initially rallied on the election news with expectations for a more business friendly environment under the new administration, although the rally faded into the holiday season. Exhibit 4 compares the 11 previous periods of Republican presidential victories with returns the following year. Historically, the median return over the next 12 months was a drawdown of 4.9% with a range of +32.2% to a drawdown of 14.7%. Volatility on average was lower, but interestingly the index saw positive returns only 36% of the time.
An exception to the Republican presidential victory experiencing muted returns during the first year in office was Donald Trump’s first year of his first term in 2017. The S&P 500 Index rallied over 20% in 2017. While anything is possible, unlike this year, 2017 was not part of a strong bull market with back-to-back >20% returns in the S&P 500 Index.
Valuations
We believe valuation is one of the more important drivers of future returns. While valuations can continue to increase well above historical averages, current valuations are very elevated relative to history with the S&P 500 LTM P/E >20 times. Of the 25 other observations over the past 99 years, the median return over the next year was 7.1% with a range of 28.7% to a drawdown of 37.0%. Even with the higher valuations, volatility was below the longer-term average and the index saw positive returns 68% of the time the following year.
Concluding Observations
Whether it was back-to-back >20% returns, Republican presidential victories or elevated valuations, all three environments experienced years with returns over 30%, as well as double-digit negative returns, so the range of possible outcomes is immense. With the CBOE Volatility Index (VIX) currently at levels below the longer-term averages (17.4 as of December 31, 2024, versus 25-year average of 19.5) valuations elevated but not as extreme as dotcom days and due to uncertainty about President-elect Donald Trump’s focus for the first 12 months of his term, we would not be surprised if the outsized returns experienced over the past several years were more muted. We believe investors should diversify their portfolios to participate in a potential boom year, but not be overexposed in the event of a large downturn.
A special acknowledgment to Quantitative Portfolio Manager Alex Atanasiu for the data collection noted in Exhibit 4.
1 The two other periods that growth outperformed by more than 60% cumulative in the previous two years, value outperformed growth over the next 12 months: Q4 1999 (29.8% value outperformance) and Q1 2000 (43.4% value outperformance).
2 For more reading our on perspective of higher quality small cap, please see (Quarterly Statements: Q1 2024, Q4 2023 and Q3 2023)
3 The Herfindahl-Hirschman Index (HHI) is a common measure of market concentration. The HHI is calculated by squaring the market share of each firm, and the “effective number of names” in an index is using the reciprocal of HHI. For additional reading on this topic, please see the Q3 2024 Quarterly Statement.
Additional disclosures for Exhibit 4:
LTM P/E is defined as last twelve months (LTM) price-to-earnings ratio (P/E) which is calculated using the company’s most recent price and dividing by the latest fiscal year earnings per share.
Count is the number of observations.
Average return is the annual average return of the observed periods.
Median return is the annual median return of the observed periods.
St. Deviation is standard deviation which is a measure of volatility.
Positive frequency is the number of observations with a positive value (in this case a positive return).
Maximum and minimum are the maximum or minimum value of the observed periods.
All data is as of 12/31/2024 unless otherwise noted. Opinions represent those of Glenmede Investment Management LP (GIM) as of the date of this report and are for general informational purposes only. This document is intended for sophisticated, institutional investors only and is not intended to predict or guarantee the future performance of any individual security, market sector or the markets generally. GIM’s opinions may change at any time without notice to you. Any opinions, expectations or projections expressed herein are based on information available at the time of publication and may change thereafter, and actual future developments or outcomes (including performance) may differ materially from any opinions, expectations or projections expressed herein due to various risks and uncertainties. Information obtained from third parties, including any source identified herein, is assumed to be reliable, but accuracy cannot be assured. This paper represents the view of its authors as of the date it was produced, and may change without notice. There can be no assurance that the same factors would result in the same decisions being made in the future. In addition, the views are not intended as a recommendation of any security, sector or product. Returns reported represent past performance and are not indicative of future results. All results reported are of unmanaged indices, used just as illustrations for various market segments. These do not reflect what an actual investment in this sector would achieve, as it includes no accounting for trading costs or fees. Performance of any particular investment in one of these market segments could be lower or higher than what is reflected above.
