Beyond the Surface
Beyond the Surface: Peripheral Impacts of a Higher Cost of Capital on Small Cap Markets
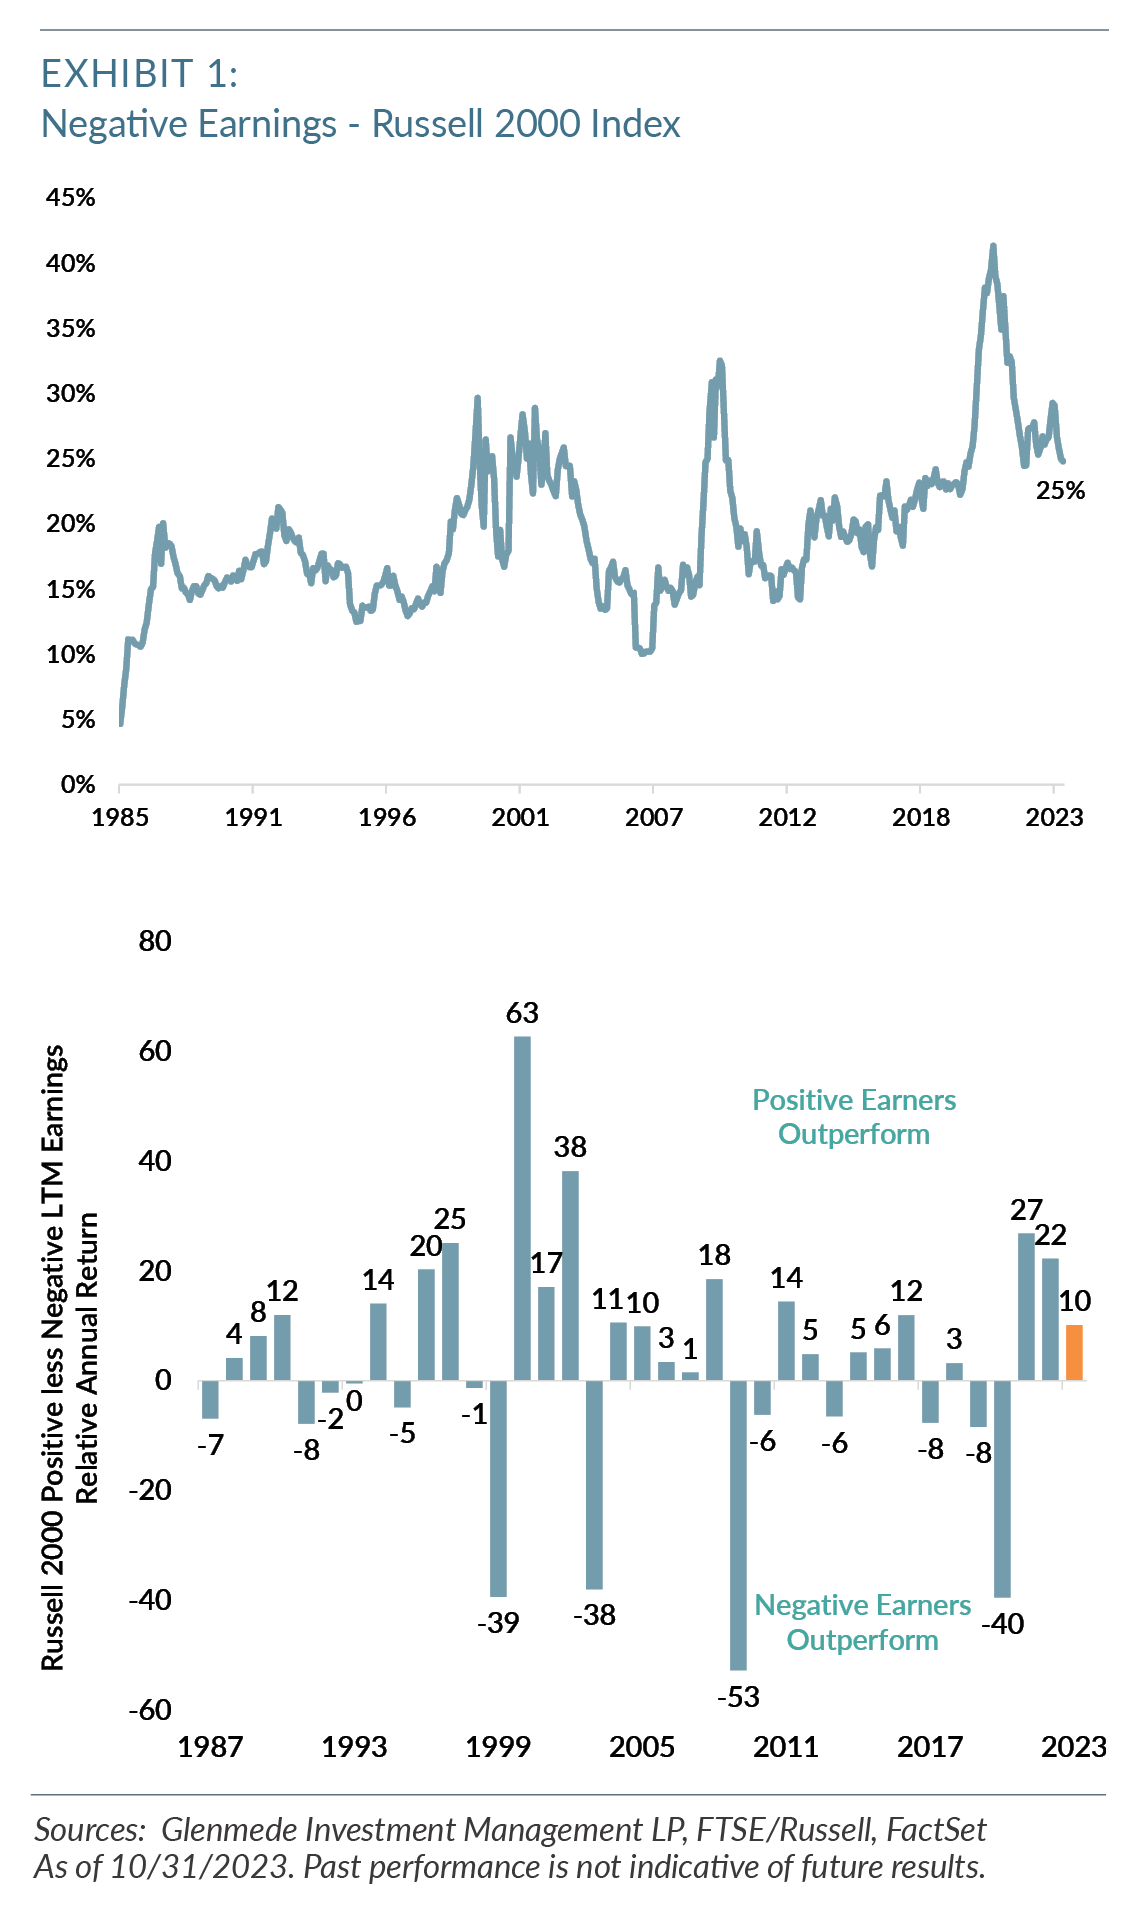
In our October 2020 paper “Why Profitability Matters: Positive Versus Negative Earnings,” we noted the historically elevated proportion of negative earners in the Russell 2000 Index and offered insights into that cohort’s disproportionate impact on performance. At the time, we posited that negative earner outperformance was a cyclical phenomenon primarily driven by investor behavioral biases related to unprecedented central bank interventions and easy monetary policies.
We concluded that companies with positive earnings would once again prove to be a winning investment strategy in a more normal interest rate environment and that negative earners would underperform. This underperformance, in turn, would cause the percentage of negative earners in the benchmark to mean revert to levels more in line with history, ~20%. The ensuing three years have shown that our thesis was correct in identifying the negative earner bubble and its subsequent underperformance, but our expectation for a commensurate decline in the percentage of negative earners in the benchmark has not yet fully materialized (Exhibit 1).
In this paper, we examine other areas of financial markets that were outsized beneficiaries of excess liquidity provided by the zero interest rate policies from 2010 to 2022, with a focus on the small market capitalization segment. We examine the decline in the number of publicly listed equities and the parabolic growth of private markets during this low-rate environment. We then consider dynamics in the IPO market and the impact that “lower quality” IPOs have had on small cap markets. Finally, we will offer some thoughts on the effects that higher interest rates could have on this whole construct and how we see those being resolved.
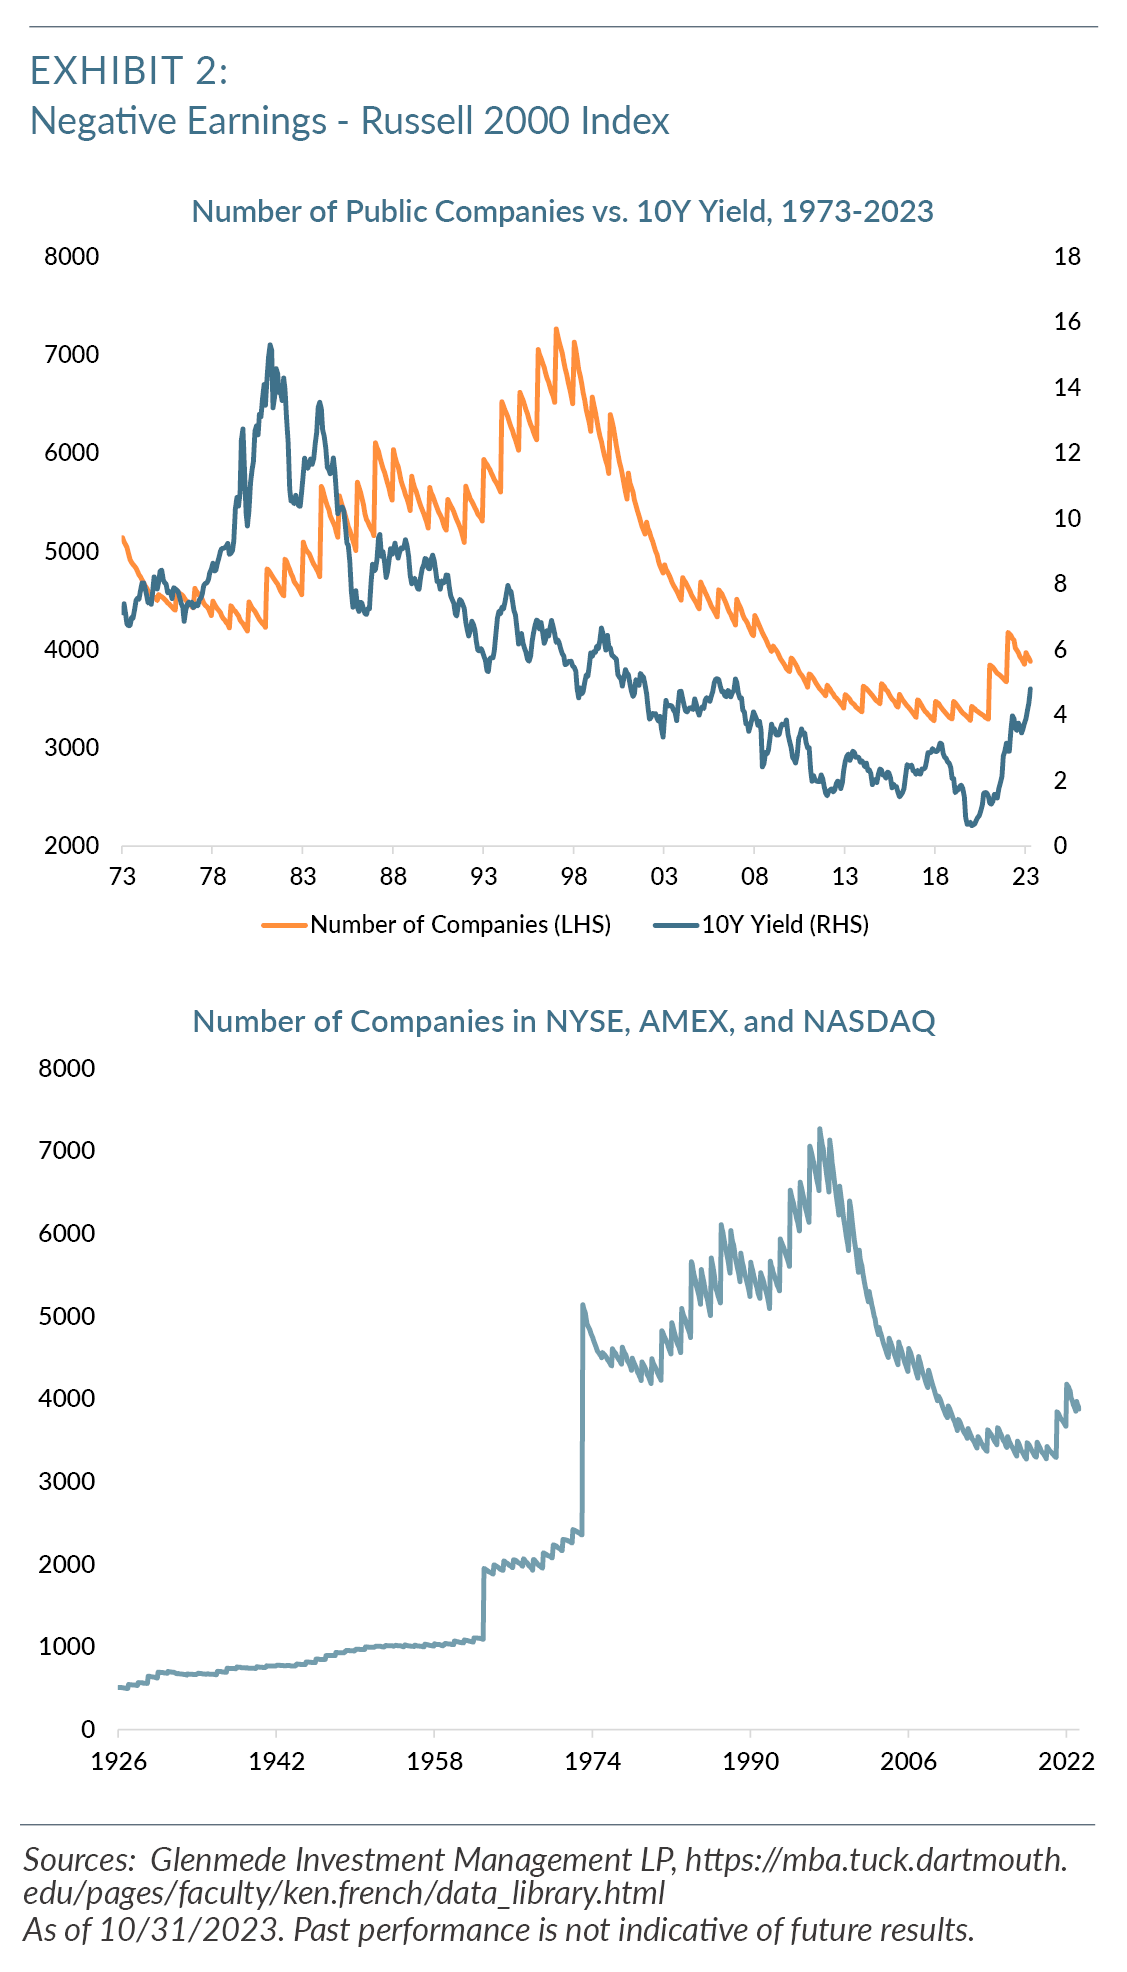
Our first area of consideration is the multidecade decline in the number of publicly listed equities. Exhibit 2 demonstrates that the number of public companies has been declining since the peak of the speculative dot-com bubble in 2000. Increased costs and regulatory requirements have likely played a part in a company’s decision to remain in the private market as opposed to going public, but we doubt that this tells the entire story. Instead, we would contend that the multidecade decline in interest rates has played a significant role in the decision of many companies to remain private. We believe it is a sensible decision for a company to access capital and reinvest in its business for a premium return while remaining private. We have plotted the number of public companies alongside the 10-year Treasury rate and there does seem to be a correlation.
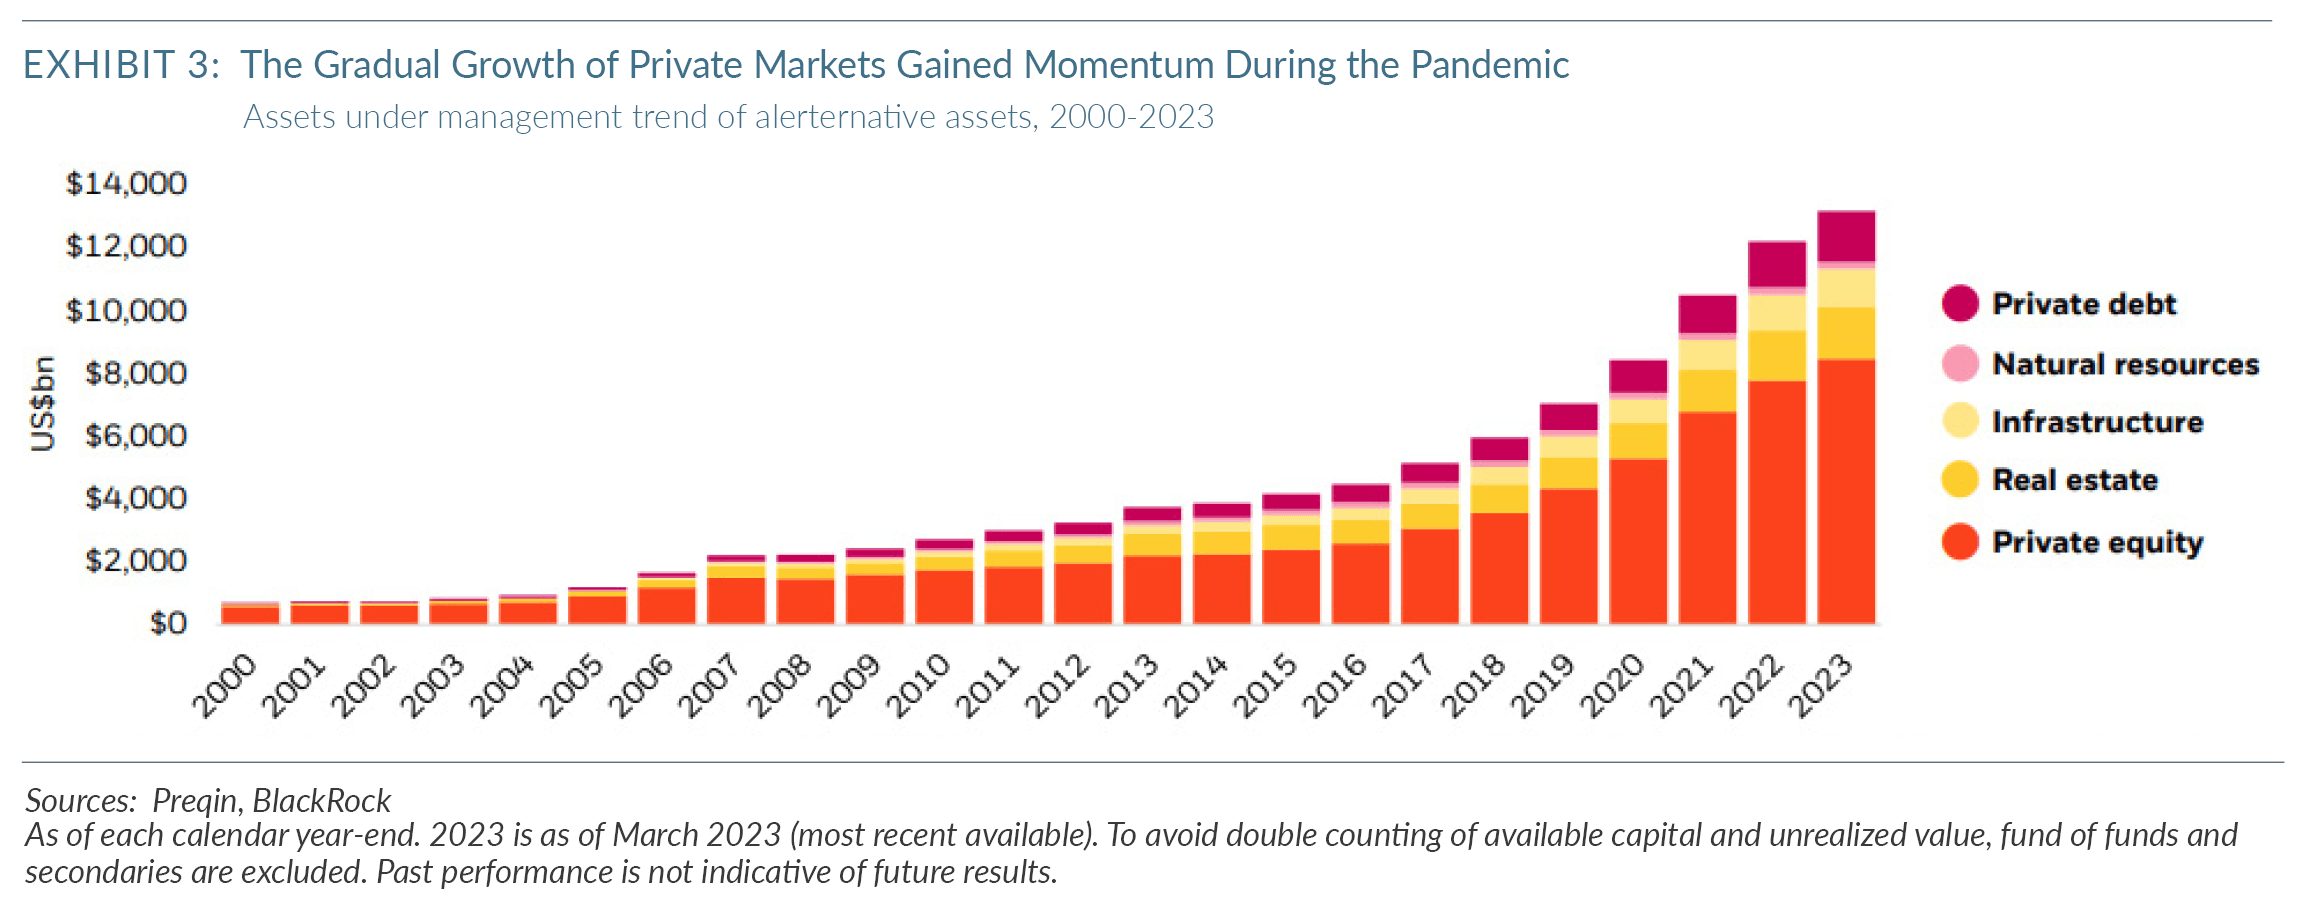
The role of interest rates and the cost of capital are underappreciated factors in the changing dynamics of market structure and the nature of businesses in public markets. A low to nonexistent discount rate created an exceptionally low hurdle to clear to justify various capital investments, which meant that private market investors were willing to pursue increasingly risky business models in the hopes of capturing a return on capital. Along these lines, Exhibit 3 suggests that the decline in interest rates post Great Financial Crisis and the boost in liquidity following the COVID pandemic led to a parabolic increase in private market assets under management (AUM).
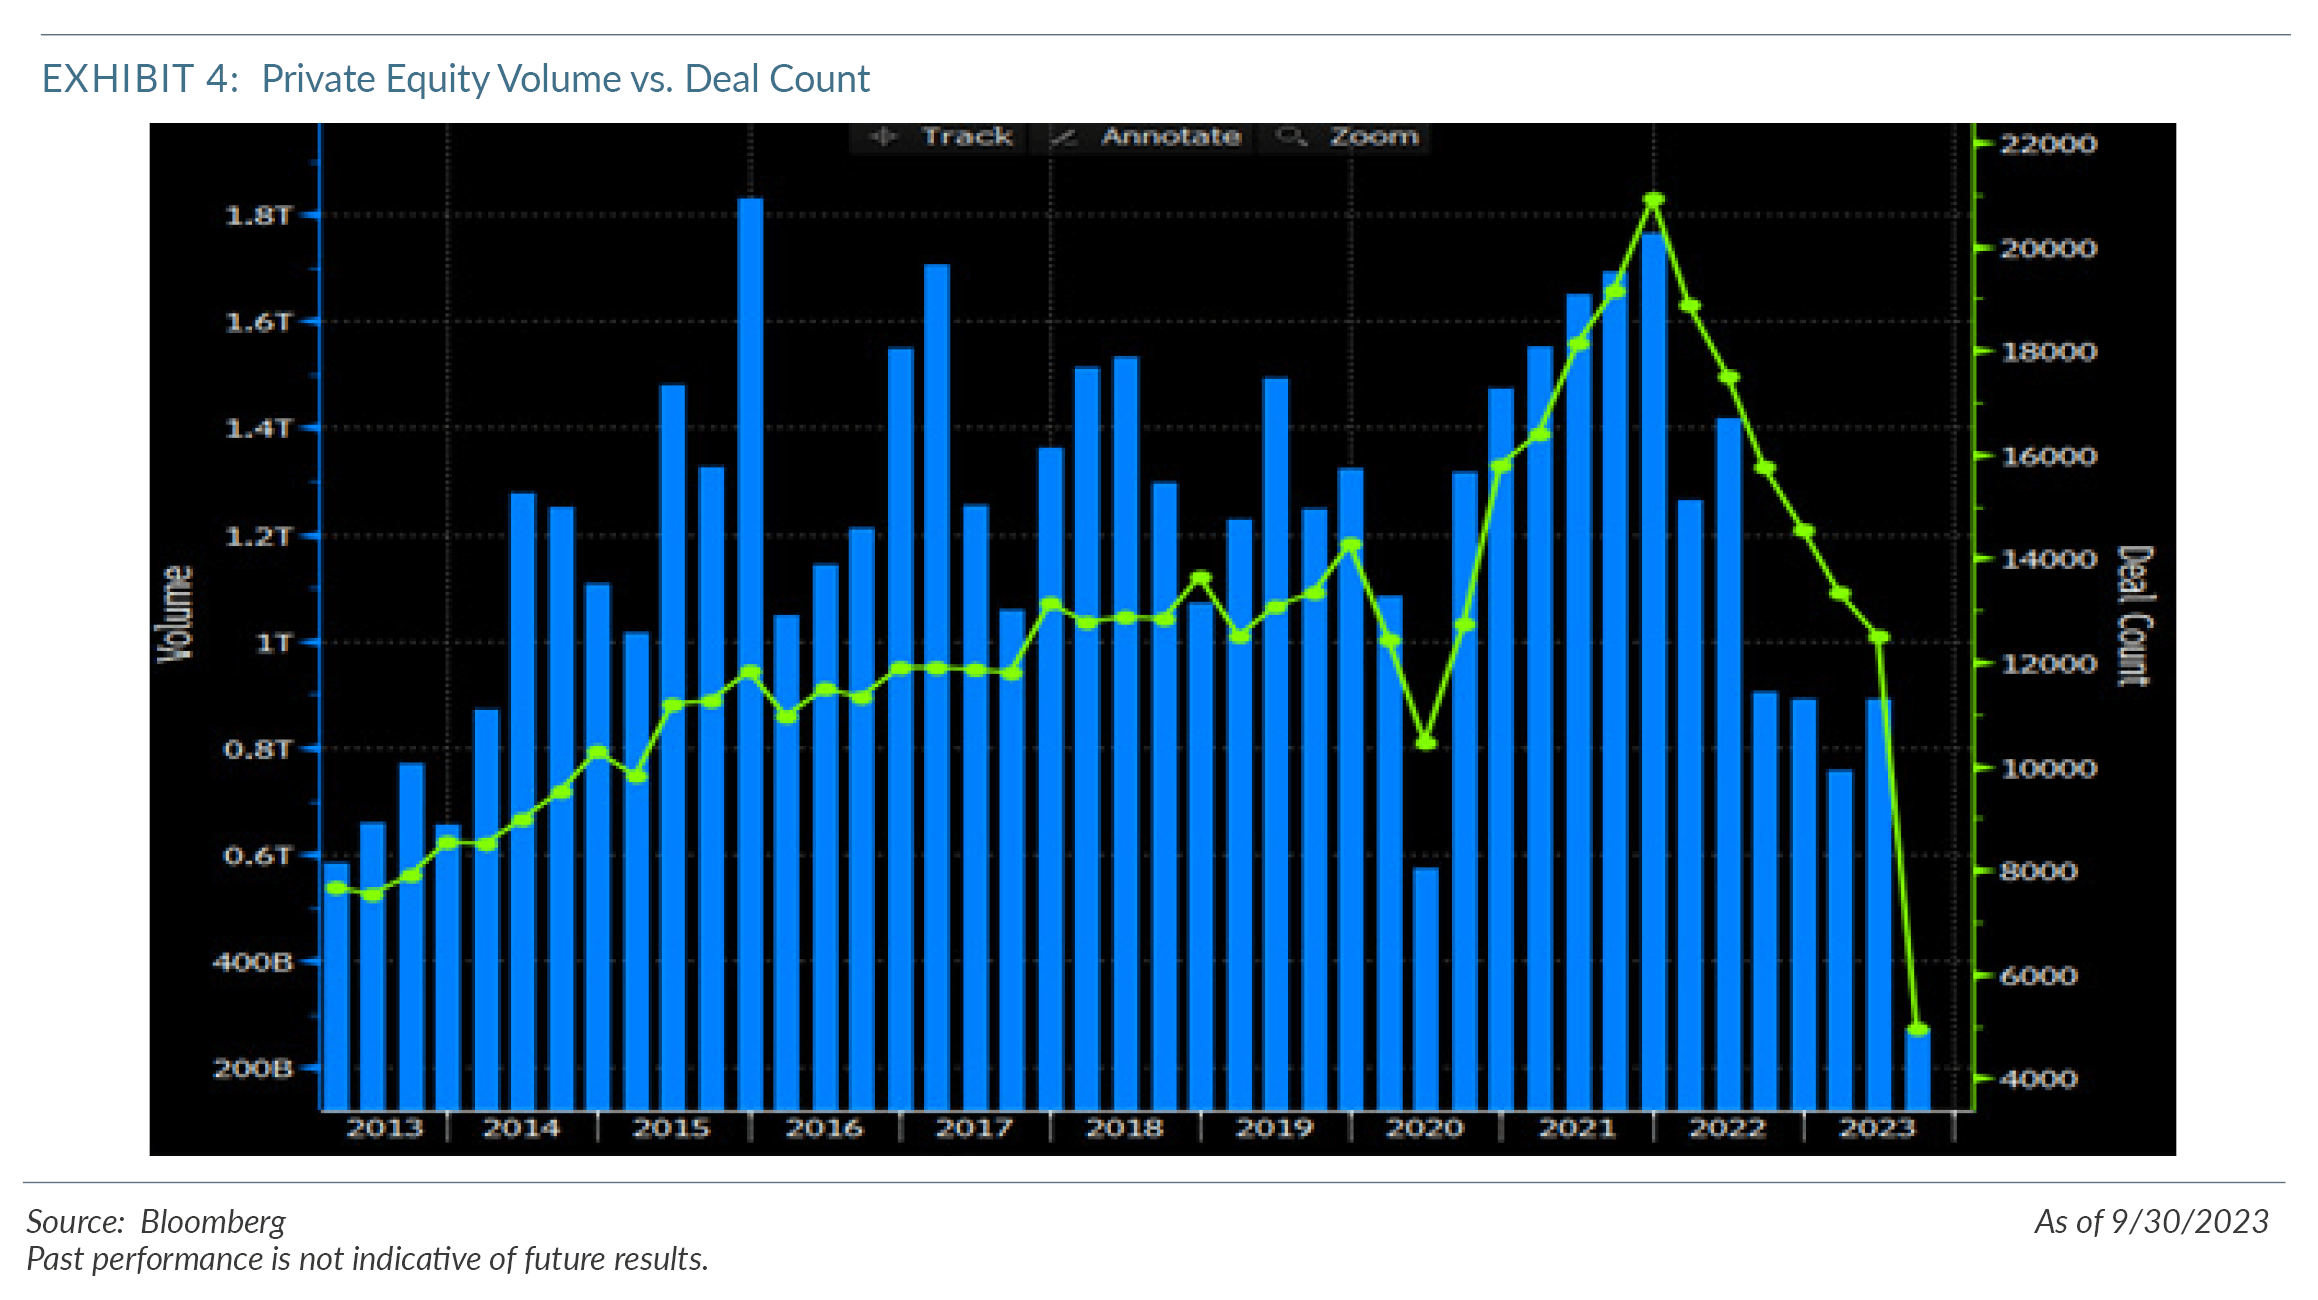
This increase in private equity AUM meant there was a commensurate increase in the number of deals that were pursued as this capital was put to work. Private market firms took advantage of the low interest rate funding environment and typically sought out higher quality businesses to acquire in both the public and private markets. In particular, low rates drove a resurgence in leveraged buy outs in which the deal is financed primarily with debt, as opposed to owner capital. In this type of deal, a cash flow positive (higher quality) business is particularly attractive as those cash flows can be used to pay a dividend to the acquiring sponsor firm to achieve a higher internal rate of return. This is a key dynamic that has led to fewer listed public equities as well the persistence of lower quality/negative earning businesses. Exhibit 4 suggests that the level of interest played a role in the deal-making environment as the deal count dropped precipitously as soon as the Federal Reserve began its interest rate normalization process.
If our contention is correct that private market investors have had an influence in the number of public companies, it is worth examining the underlying activity in IPOs over the past five years as this was typically how investments were exited. As can be seen in Exhibit 5, IPO activity maintained a relatively stable pace until the significant uptick during the latter half of 2020 and the record IPOs in 2021. This increase in activity corresponded with the monetary response to the COVID lockdowns and an increase in risk taking that took place during the lockdowns. It is not surprising that the pace of IPOs slowed to a trickle during the financial market declines in 2022 as risk appetite evaporated.

Following the IPO surge in 2021, public markets were not as receptive in 2022, and the story has remained the same in 2023. The subsequent negative performance of the IPOs launched in 2021 would seem to have much to do with that. The poor performance of the IPO group we believe is tied to the rise of the Special Acquisition Corporation (SPAC) vehicle. SPACs failure to have durable business models led to a significant loss of value for their shareholders. More than 20 global companies made their debut in 2021 at initial valuations above $10 billion. At this writing (12/19/2023), these companies have lost ~60% of their value1. Once again, the increased level of interest rates has further pressured the valuation multiples afforded to these businesses as well as stressing their underlying revenue growth models.
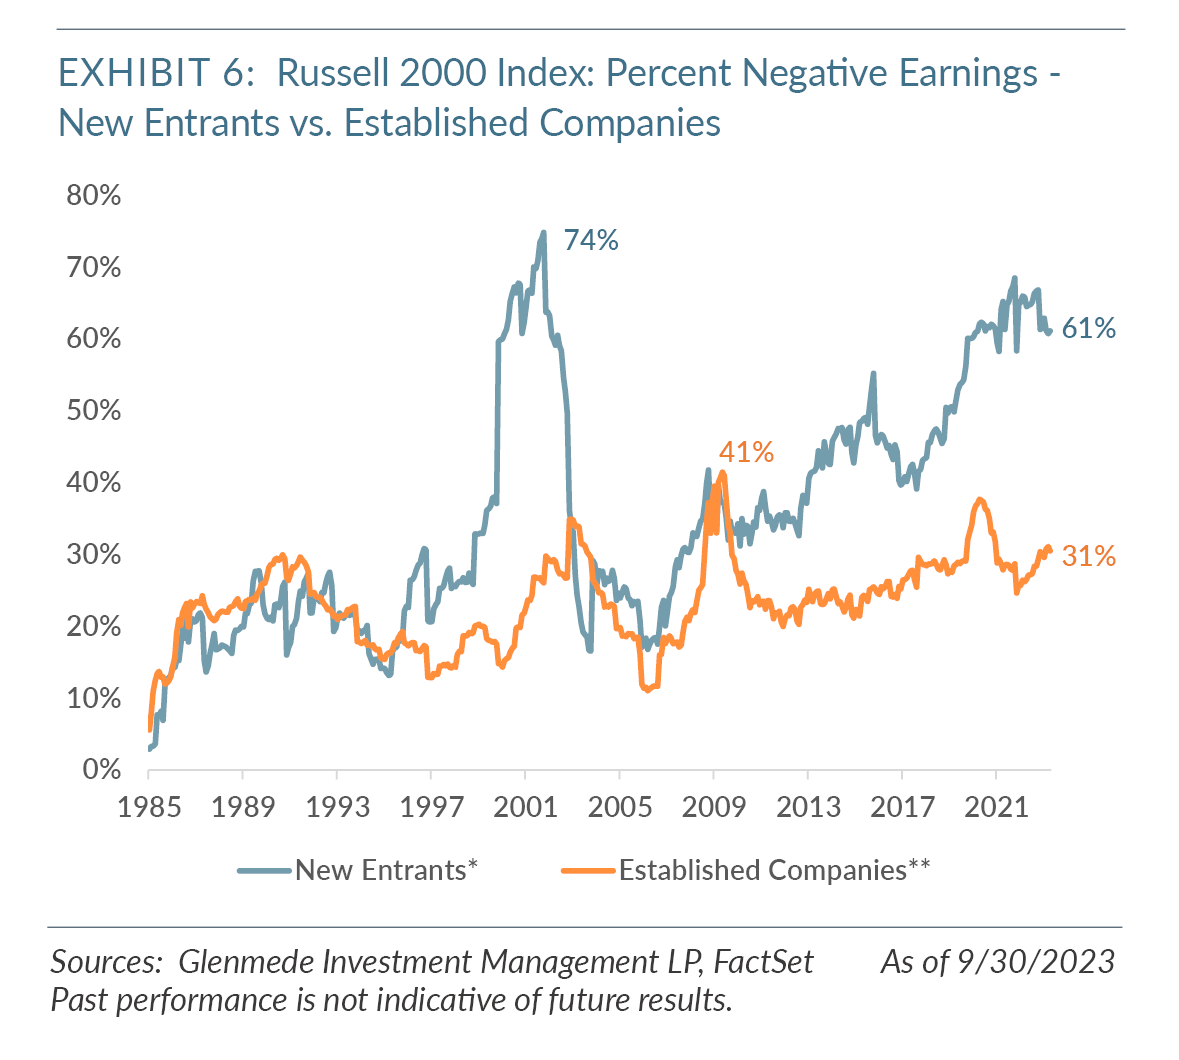
It is possible that higher quality companies (i.e., businesses with positive earnings) that would normally have been brought to public markets through an IPO have remained private and, instead, lower quality businesses have gone the IPO route to monetize the investment. Abnormally low interest rates and excess liquidity meant that sponsor firms were able to simply trade companies back and forth in the private market to reap the gains that once could only be unlocked through an IPO. This phenomenon could account for the increase in the percentage of negative earners in the benchmark as well as their continued persistence. Exhibit 6 shows the percentage of companies that have entered the Russell 2000 Index in the past three years without any prior trading history. The current level of 62% was only surpassed during the dot-com bubble. One can assume that these issues are spinoffs of IPOs.
In contrast, Exhibit 6 also depicts the percentage of the index comprising “established companies”, (those with three years of trading history), and shows this level has declined from 37% to 30%. These charts together indicate that new public companies are twice as likely to have negative earnings than other Russell 2k constituents, consistent with an increase in the lower quality IPOs we have noted.
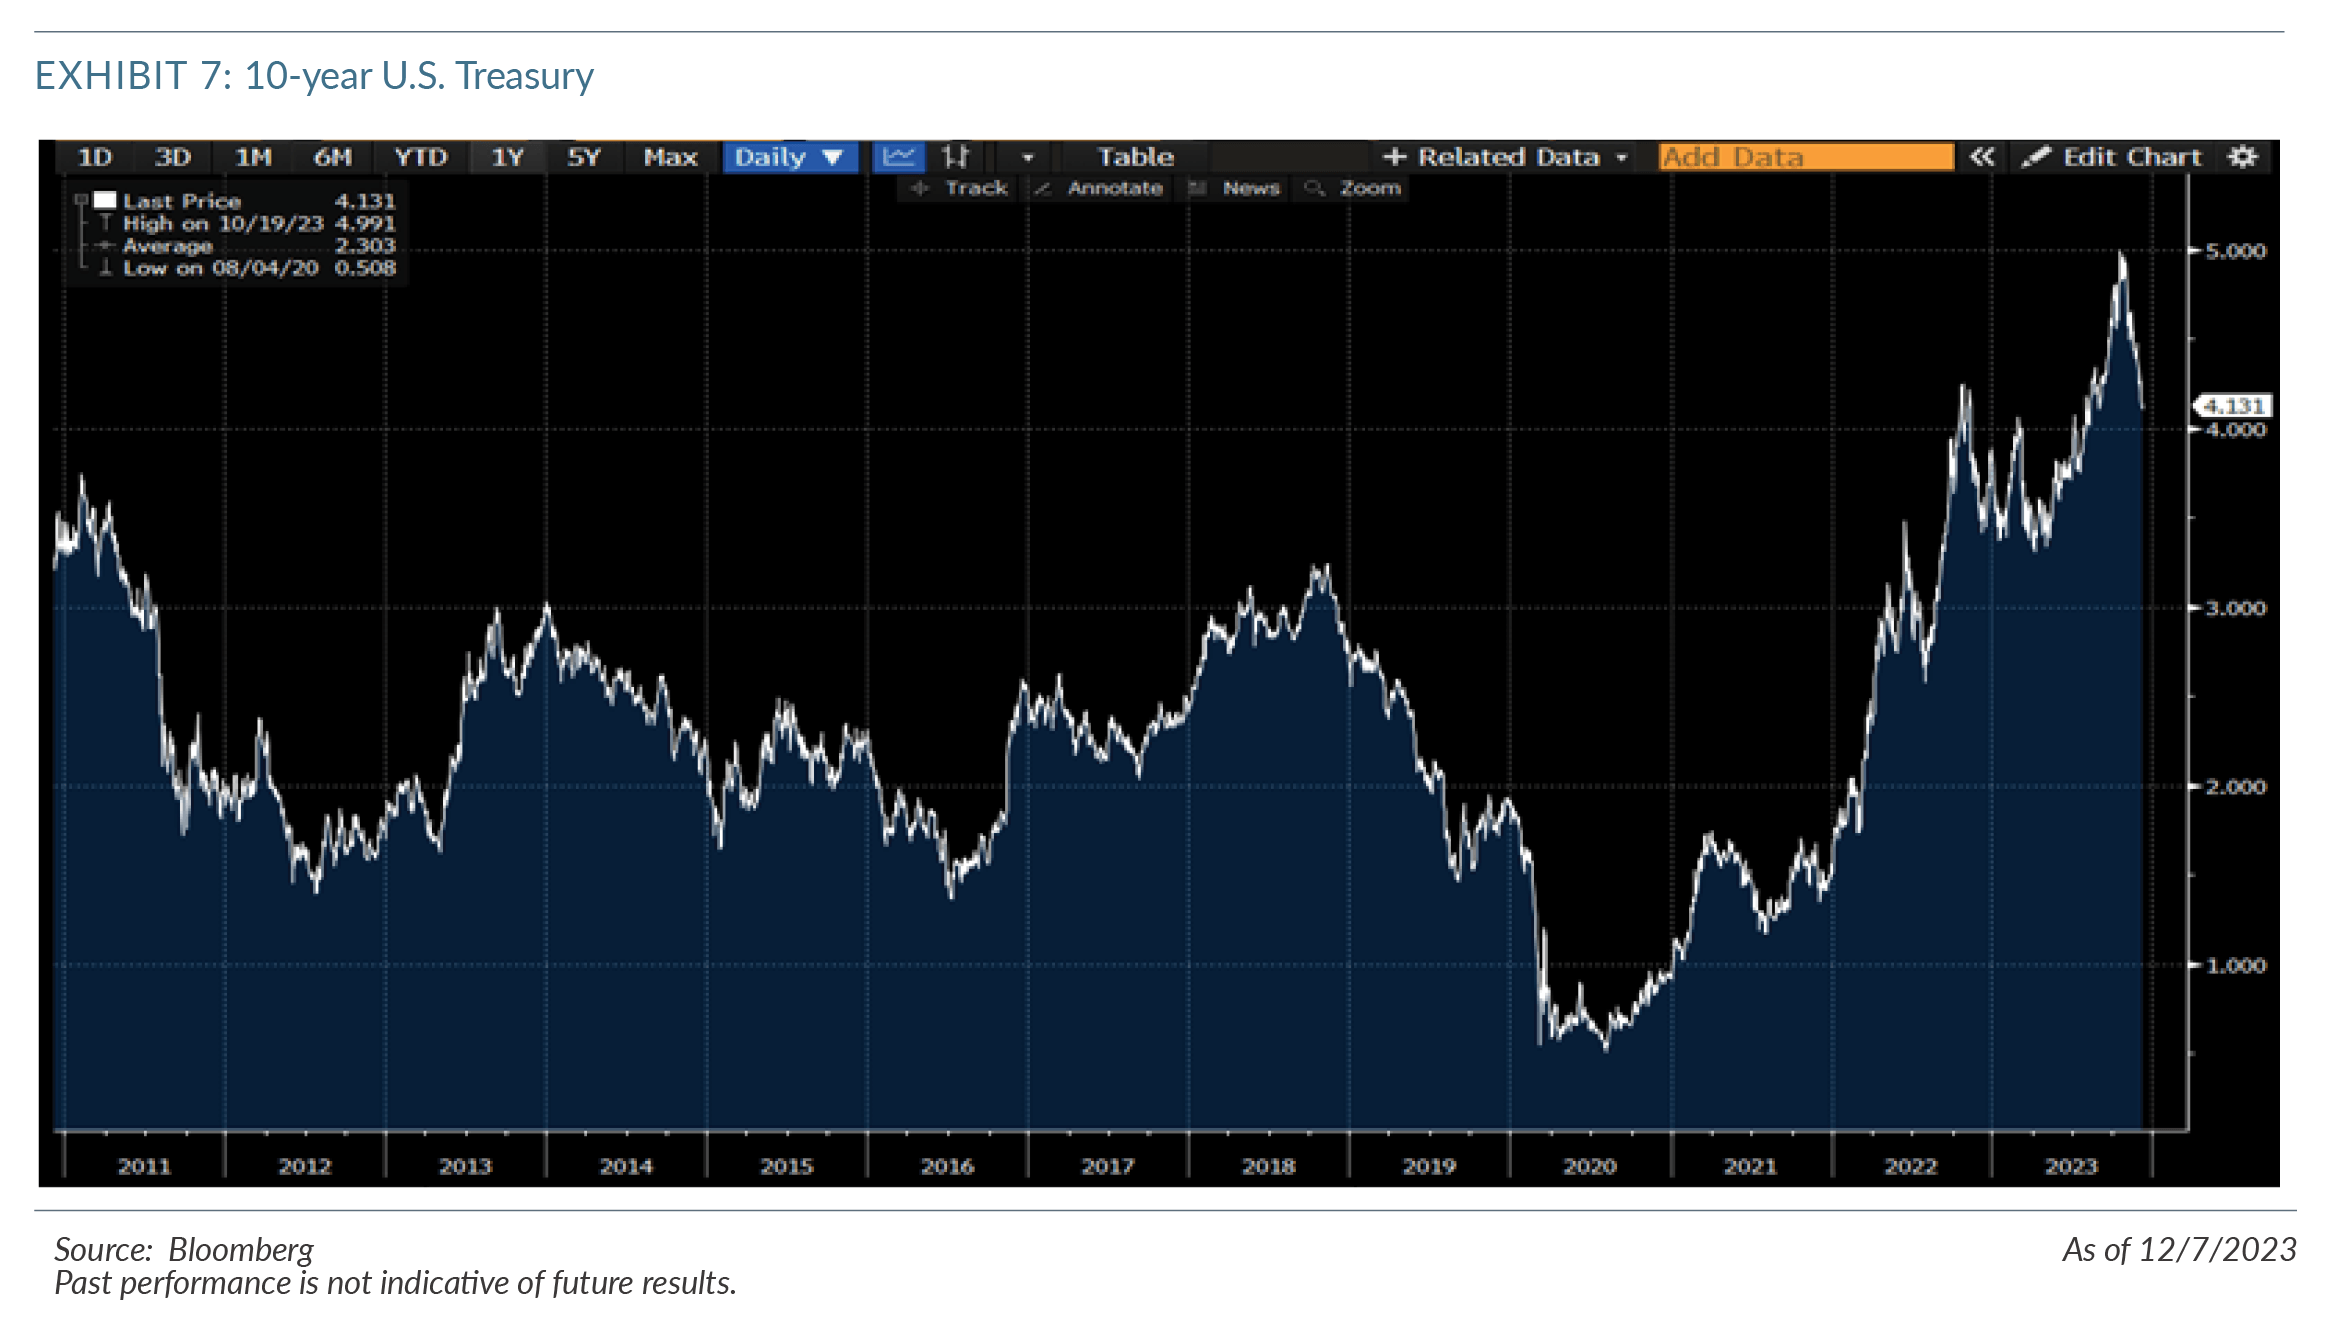
The common theme in this discussion is that the interest rate environment has come off the zero bound range and is unlikely to return to that level. Whether the U.S. 10-year Treasury yield is 5% or 4% is irrelevant. There is a cost to capital again, which means that the business model that was reliant on new capital for growth as opposed to self-sufficient revenue generation is dead. We think it likely that the negative interest rate environment will be shown to have been anomalous and that a return to more traditional capital markets activities and funding forms lies ahead. With that said, investor psychology takes time to shift and market leadership transitions rarely occur in a straight line. To illustrate, Exhibit 7 depicts the changes in the yield of the 10-year U.S. Treasury.
At some point, private equity participants and their investors need an exit for their investments to meet liquidity needs. If higher interest rates crimp their ability to trade assets back and forth, it is likely that sponsor firms will need to tap the public markets through IPOs to monetize their investments. Should this come to pass, it is likely that it will not simply be the lower quality businesses being introduced to the public markets, but also the higher quality ones with earnings. Similarly, public companies could divest noncore assets through spinoffs to unlock shareholder value and garner a higher share price. Assuming this occurs, we believe it is reasonable to expect that the percentage of negative earners in the benchmark will begin a mean reverting march toward its historic levels of ~20% as higher quality assets are reintroduced to the public markets.
Author:
Jordan L. Irving
Portfolio Manager, Small/Mid Cap Equity
1 Crunchbase news. https://news.crunchbase.com/public/biggest-ipos-2021-current-value-didi-rivn/
All data is as of November 30, 2023 unless otherwise noted. Opinions represent those of Glenmede Investment Management LP (GIM) as of the date of this report and are for general informational purposes only. This document is intended for sophisticated, institutional investors only and is not intended to predict or guarantee the future performance of any individual security, market sector or the markets generally. GIM’s opinions may change at any time without notice to you.
Any opinions, expectations or projections expressed herein are based on information available at the time of publication and may change thereafter, and actual future developments or outcomes (including performance) may differ materially from any opinions, expectations or projections expressed herein due to various risks and uncertainties. Information obtained from third parties, including any source identified herein, is assumed to be reliable, but accuracy cannot be assured. This paper represents the view of its authors as of the date it was produced and may change without notice. There can be no assurance that the same factors would result in the same decisions being made in the future. In addition, the views are not intended as a recommendation of any security, sector or product. Returns reported represent past performance and are not indicative of future results. Actual performance may be lower or higher than the performance set forth above. For institutional adviser use only, not intended to be shared with retail clients.
The Russell 2000 Index is an unmanaged, market value weighted index, which measures performance of the 2,000 companies that are between the 1,000th and 3,000th largest in the market. One cannot invest directly in an index.