Market Snapshot: Viewing Drawdowns as a Bump in the Road
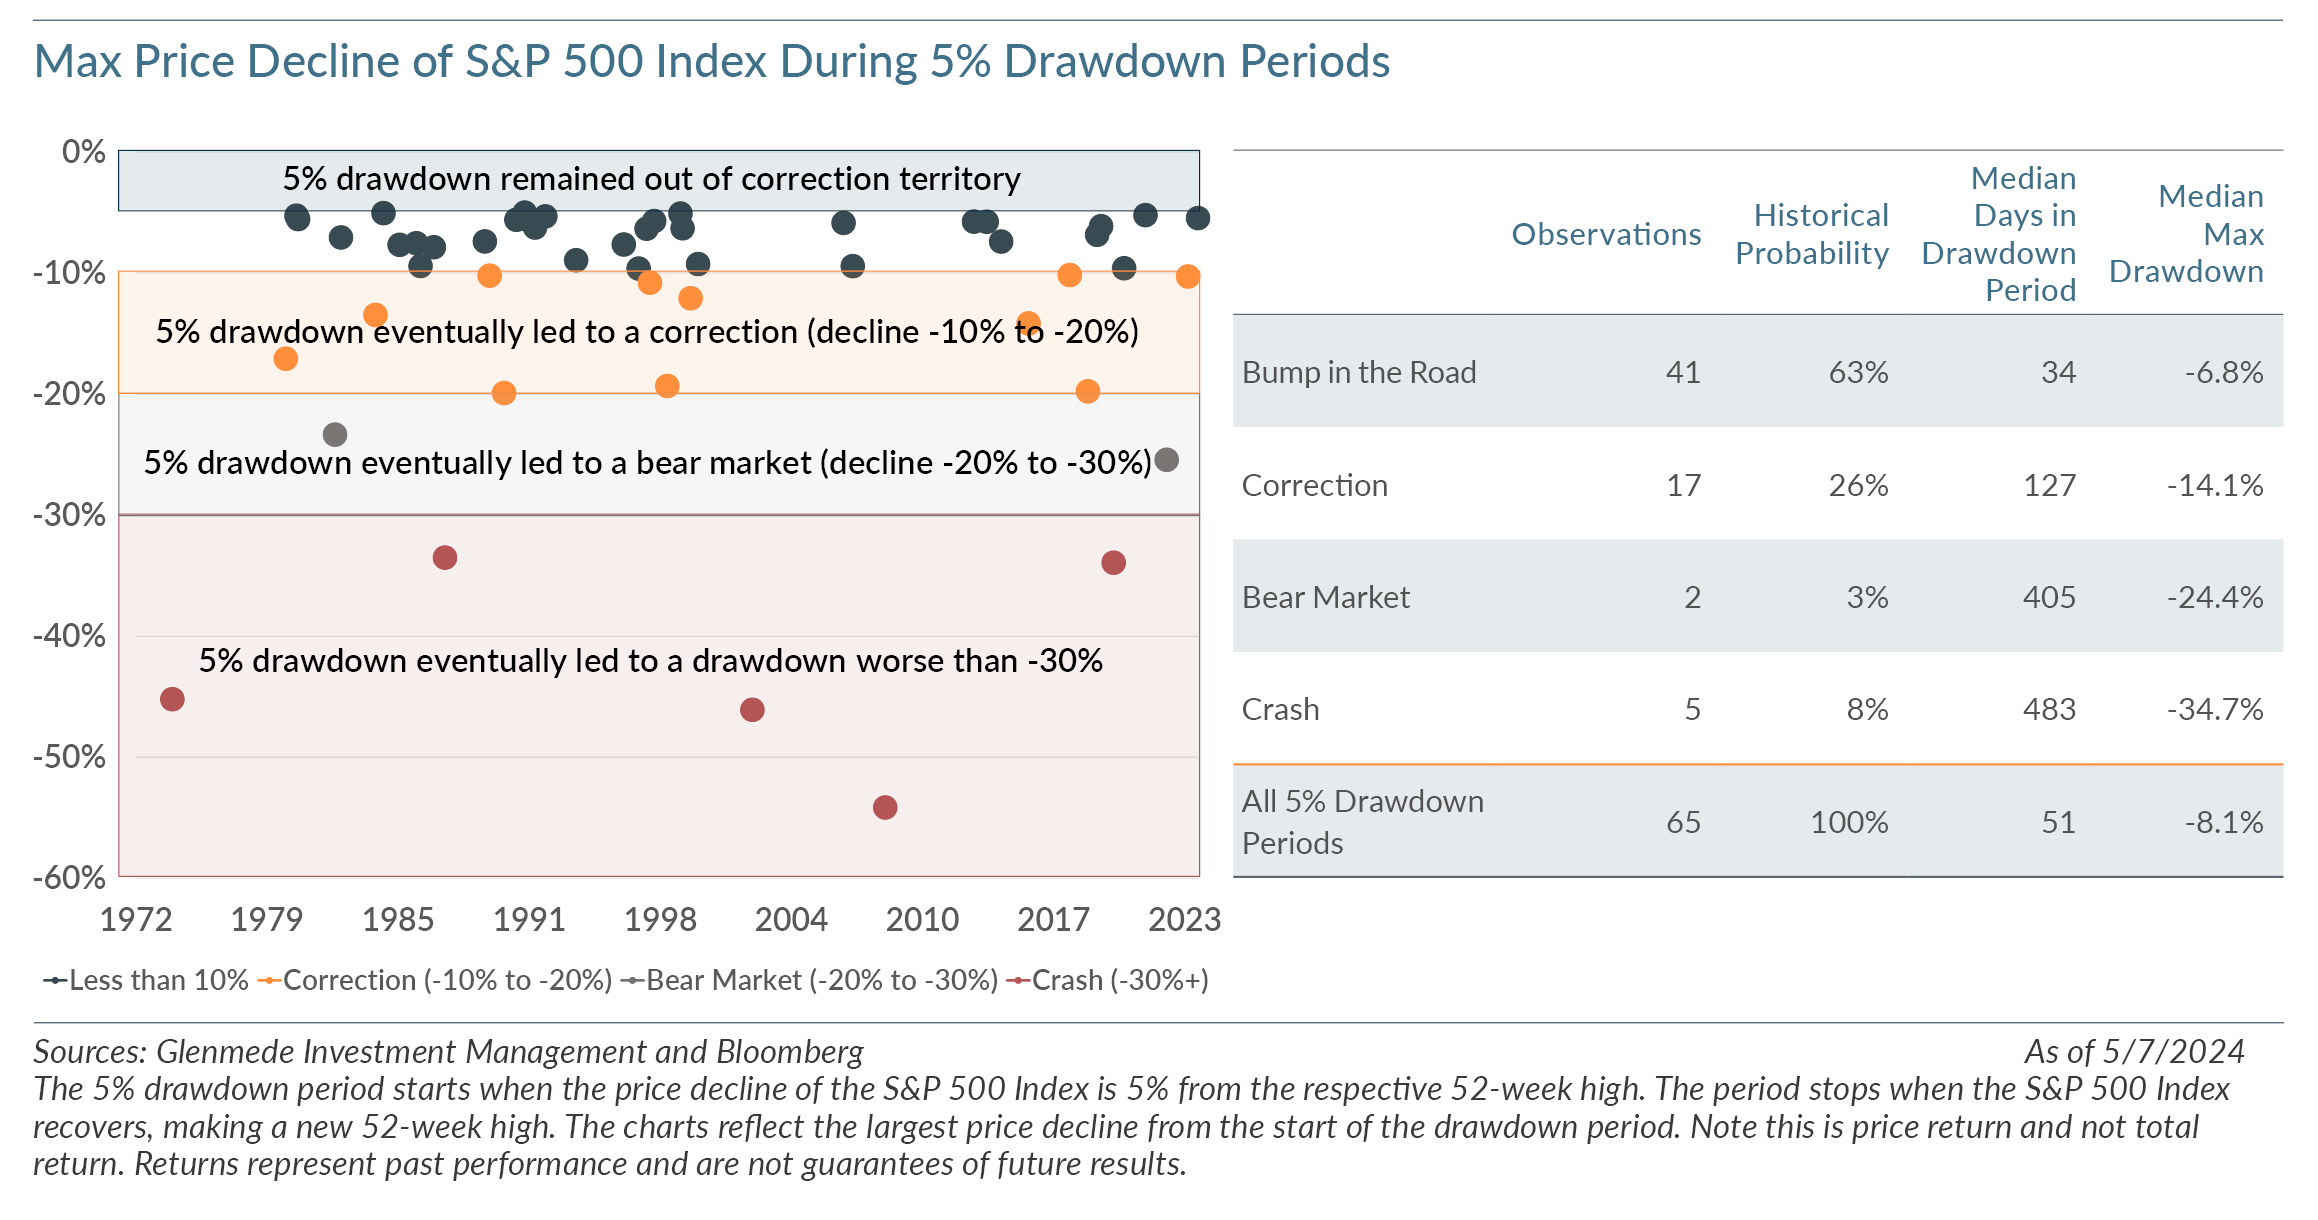
Based on our analysis, a 5% drawdown is just under twice as likely to be a non-event (less than -10% peak drawdown) versus becoming a correction (a price decline of 10% but less than 20% from the 52-week high), bear market (a price decline between 20%-30% from the 52-week high) or crash (a price decline of 30% from the 52-week high).
Over the past 50 years, the S&P 500 experienced 66 unique 5% drawdown periods¹ from the respective 52-week high, with the most recent occurring on Friday, April 19, 2024. As noted in the chart, a correction occurred in 17 of the previous 65 drawdowns, a bear market in 2 of the 65 drawdown periods, and a crash in 5 of the 65 drawdown periods. In other words, a 5% drawdown has historically been 1.7x more likely to experience a max drawdown above correction territory than to experience a correction, bear market or crash. The average max drawdown during these periods was 11.8% with a max median drawdown of 8.1%. The average number of trading days before the index saw a new 52-week high was 114 days, with a range of two days to 842 days, and a median of 51.
If the S&P 500 Index did not make a new 52-time high within the next 100 trading days (19 observations), there was ~90% probability that the market experienced a max drawdown of 10% or more (17 of the 19 observations). If the S&P 500 made a new 52-week high in the next 50 trading days (32 observations), only 3% of the observations saw a correction or worse (1 of 32 observations). Of the 32 observations when the S&P 500 saw a new 52-week high in the next 50 trading days, 35% of the observations saw the max drawdown on the first day of the drawdown period (11 of 32 observations). While 5% pullbacks may raise investor concerns of more sizable drawdowns ahead, history would suggest they are statistically more likely to be a financial bump in the road rather than a major detour to higher returns.
¹The period starts when the price decline of the S&P 500 is 5% from the 52-week high. The period stops when the S&P 500 recovers, making a new 52-week high. In some cases, the 52-week high was a new all-time high, but not in all cases.
Views expressed include opinions of the portfolio managers as of May 16, 2024, based on the facts then available to them. All facts are gathered in good faith from public sources, but accuracy is not guaranteed. Nothing herein is intended as a recommendation of any security, sector or product. Returns represent past performance and are not guarantees of future results. Actual performance in a given account may be lower or higher than what is set forth above. All investment has risk, including risk of loss. Designed for professional and adviser use.