Market Snapshot: S&P 500 High + Russell 2000 Bear = Opportunity?
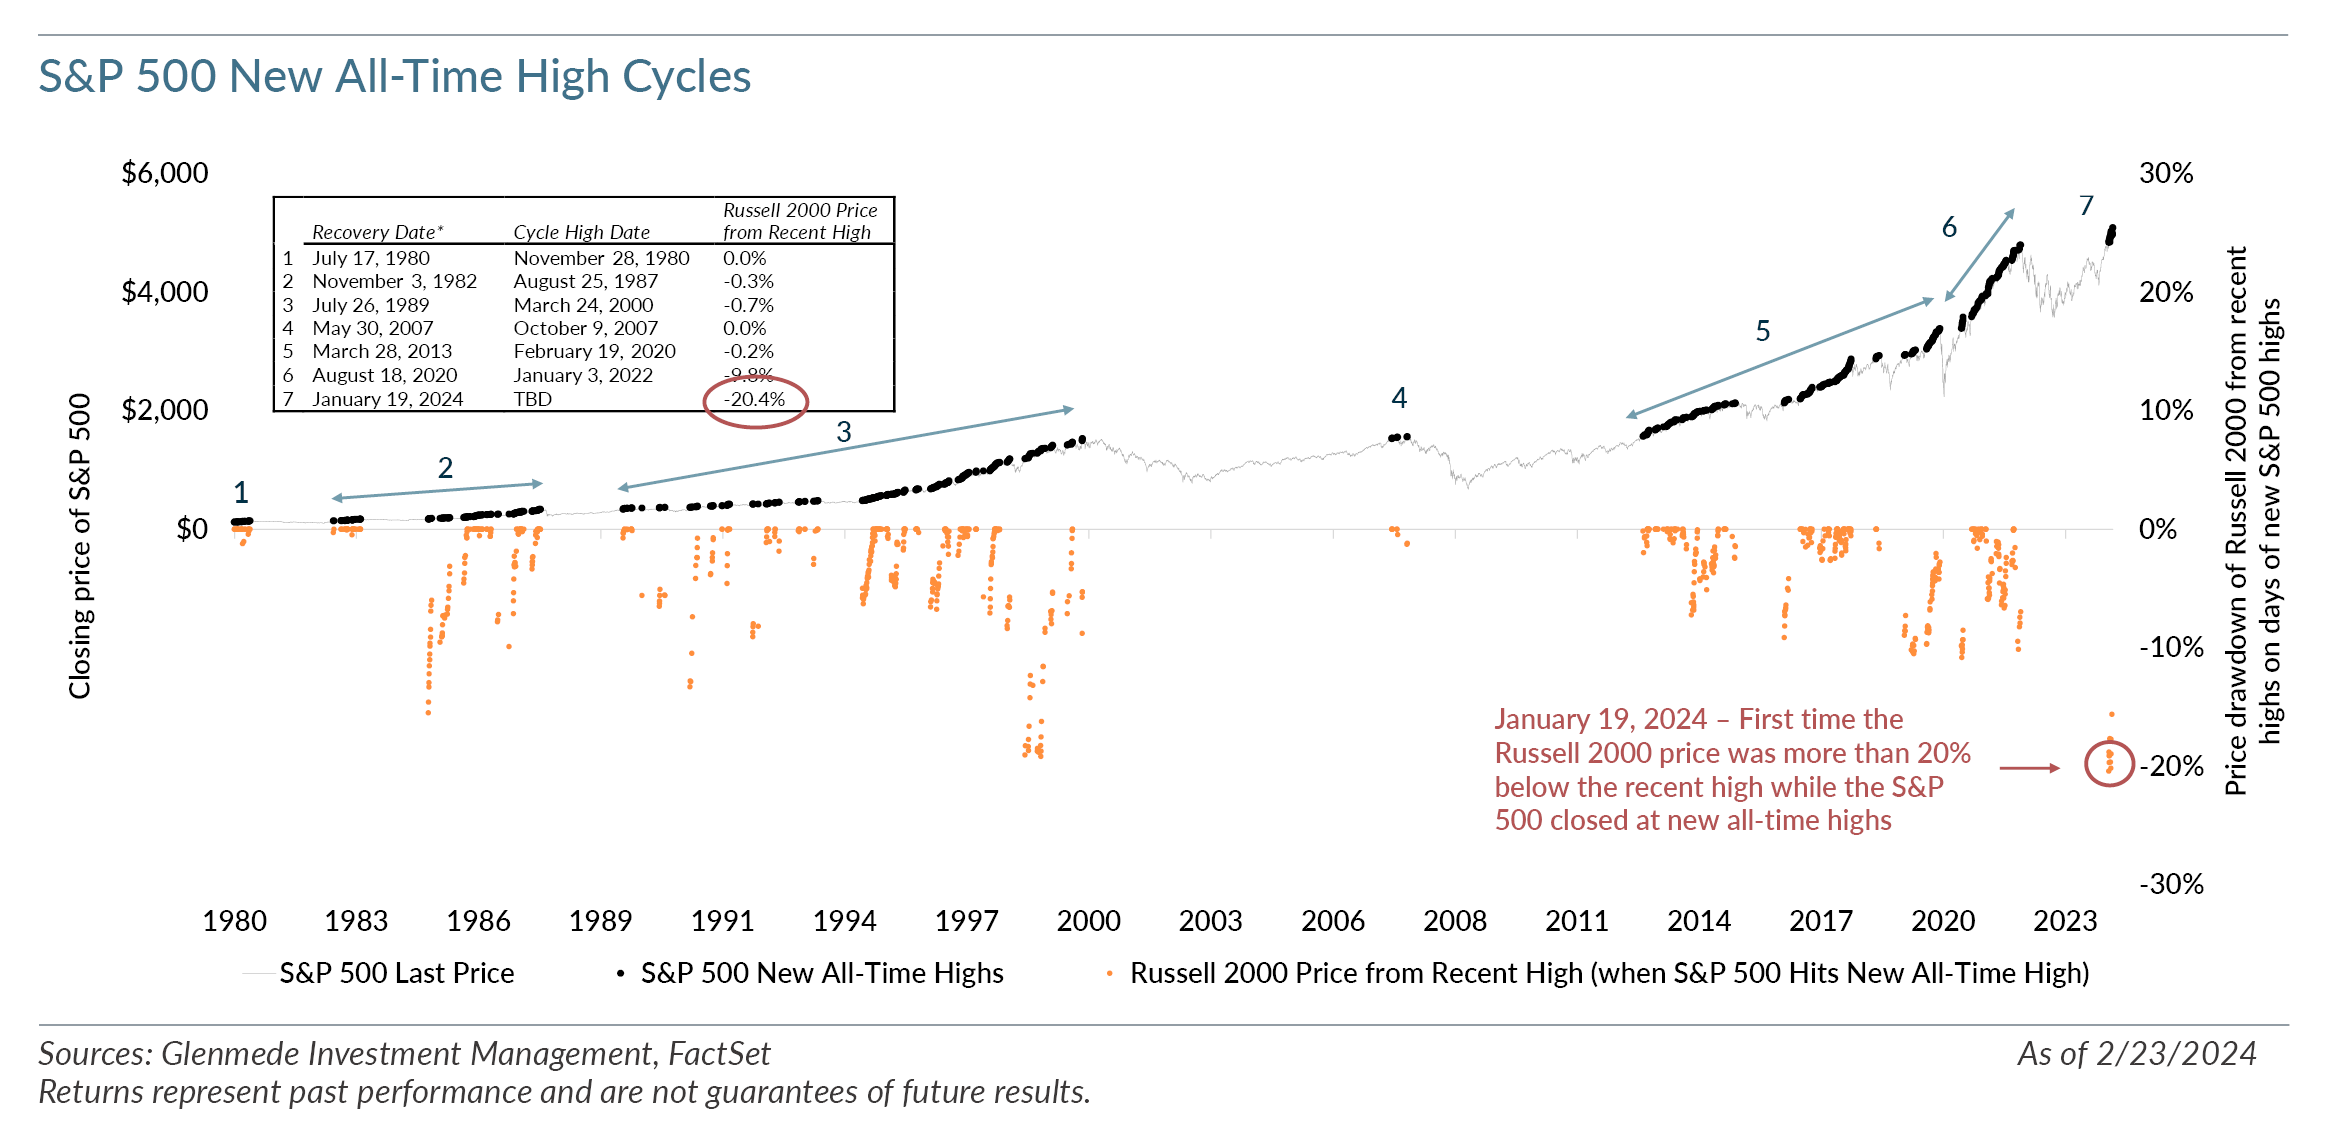
The S&P 500 began a new all-time high price cycle¹ on January 19, 2024, and as of February 23 had posted 13 new all-time highs during 25 trading days. But the cycle is much different for small caps. While the S&P 500 experienced an all-time high, the Russell 2000 remained in bear market territory, something not experienced in 43 years. On January 19, 2024, the Russell 2000 closed 20.4% down from its most recent all-time high on November 8, 2021 — the largest price difference between the S&P 500 and Russell 2000 during any of the all-time high price cycles in the past 43 years.
As background, the S&P 500 and Russell 2000 indices both hit then all-time highs on July 17, 1980. Since that time, the S&P 500 has experienced 947 new all-time price highs within 7 distinct new all-time high price cycles, as shown in the chart above. These cycles varied in length from a few months (1980, 2007, 2020-2022) to several years (1982-1987, 1989-2000, 2013-2020). The start of these new all-time high cycles tended to relatively closely accompany new highs in the Russell 2000 (reached within 30 days of the S&P high point). An exception was the COVID pandemic recovery cycle that began in August 2020. The Russell 2000 was approximately 10% from its then all-time highs when the S&P 500 had recovered, but the small cap index hit new all-time highs by November of that year. On February 23, 2024, the Russell 2000 remained 17.4% off its nearest all-time high, while the S&P 500 closed at a new all-time high.
Within small caps, we continue to believe higher-quality, positive-earning companies offer more attractive opportunities for longer-term price appreciation. As of the start of the year, when filtering out the negative earners² of the Russell 2000, the remaining positive-earning basket of stocks traded at 14x forward price/earnings (P/E), which is in the 22nd percentile of forward P/E multiples over the past 20 years. While price return charts can offer a visual of recent performance, we acknowledge that we cannot time the cycle shift to small caps. However, we believe the starting points of valuation are the more important driver in determining risk/reward for future returns, and we continue to believe higher quality, positive earners in small cap offer an attractive risk/reward.
¹ We define the start of a new-high cycle as the first new all-time price high following a 20% decline from the previous high, and the end of the cycle as the last new all-time high prior to a 20% decline. These are strictly price returns and not total returns.
² We define a negative earner as any company without earnings over the trailing 12 months. For additional reading on negative earners, please see Why Profitability Matters: Positive versus Negative Earners and Negative Earners Could Create Positive Alpha for Active Strategies.
Views expressed include opinions of the portfolio managers as of February 29, 2024 based on the facts then available to them. All facts are gathered in good faith from public sources, but accuracy is not guaranteed. Nothing herein is intended as a recommendation of any security, sector or product. Returns represent past performance and are not guarantees of future results. Actual performance in a given account may be lower or higher than what is set forth above. All investment has risk, including risk of loss. Designed for professional and adviser use.