The Quarterly Letter Q1 2025: Economic & Market Recap
Executive Summary
- The new administration kicked off with a flurry of policy changes highlighted by new tariffs, cost-cutting efforts and tax policy discussions in Congress.
- Growth expectations were downgraded for the first half of 2025, with trade policy uncertainty and inflation concerns affecting sentiment. The labor market remained tight, and the Fed held rates steady.
- The S&P 500 experienced a 10% correction, led by the Magnificent 7, and finished down -5% for the quarter. Foreign equities, bonds and diversified investment approaches held up better in comparison.
- In just the few days after the quarter-end, reciprocal tariffs have contributed to a meaningful downgrade in the economic outlook. The repricing in equities has unwound some excesses and discounted valuations notably.
The New Administration’s Big Policy Shifts
President Trump began his second term with a flurry of executive orders, many of which had notable economic implications. The most significant policy shifts involved trade, with tariffs imposed as follows: 20% on Chinese goods, 25% on steel and aluminum, and 25% on imports from Canada and Mexico. However, temporary carve-outs were granted for goods that complied with North American trade agreements. Trade policy was also wielded as a diplomatic tool, with the administration threatening 25% tariffs on Colombia and Venezuela in response to disputes around migrants and drug trafficking. Additional trade initiatives were announced but not yet implemented: 25% product-specific levies (autos, copper, lumber, semiconductors, pharmaceuticals) and reciprocal tariffs.
Meanwhile, the Department of Government Efficiency drew attention for its cost-cutting initiatives. On Capitol Hill, Congress passed a bill to fund government agencies through September, avoiding a government shutdown. Lawmakers also began shaping a reconciliation bill aimed at extending individual and corporate tax cuts set to expire at the end of 2025, as well as other tax and spending initiatives.
Diversification Delivers Despite Market Correction
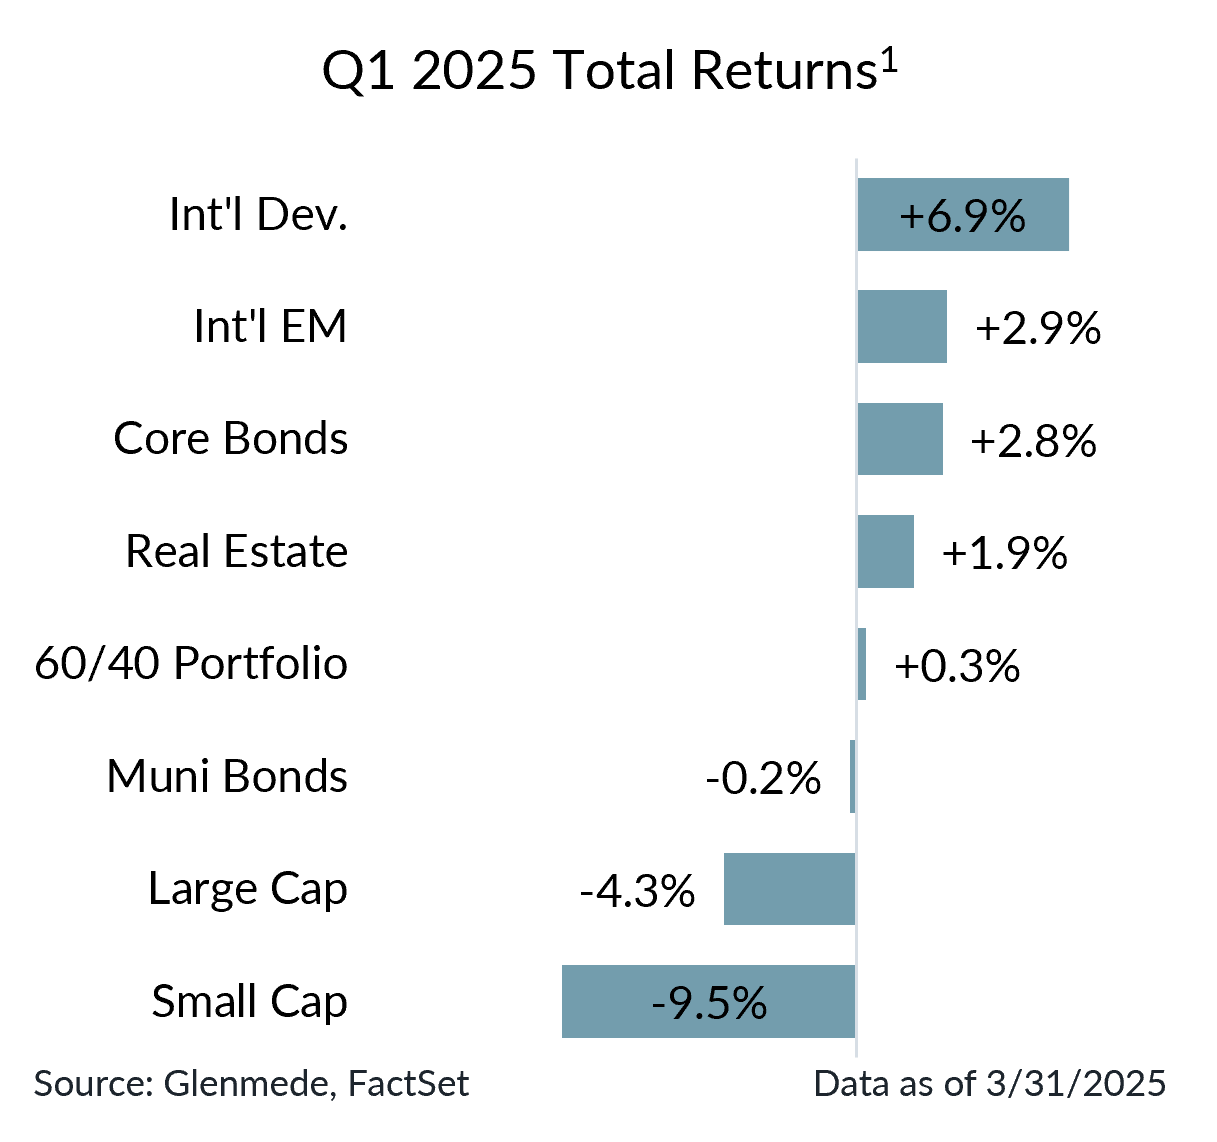
The S&P 500 experienced a 10% correction from its all-time high in Q1, a relatively common occurrence that tends to happen every 1-2 years. Most of that decline came from the “Magnificent 7” (Apple, Alphabet, Amazon, Meta, Microsoft, Nvidia, Tesla) which dropped by -14.8% while the rest of the S&P 500 rose by 0.5%. A major factor behind the volatility in these top tech stocks was the release of DeepSeek’s R1 model, which challenged existing assumptions about the pricing power of U.S. technology and America’s position in the global AI race. Small caps (Russell 2000 index) underperformed partly due to their greater economic sensitivity and exposure to Canadian and Mexican commerce amid tariff rollouts. Bitcoin also fell by -11.6% despite the administration’s announcement establishing the Strategic Bitcoin Reserve.
Diversification paid off in more ways than one, as international stocks, core bonds and real estate all posted positive returns for the quarter.1 This rotation in market leadership highlighted the pitfalls of investment processes that chase the hottest stocks and asset classes of the moment.
10-year Treasury yields fell from 4.58% at the start of the year to 4.23%. The Treasury yield curve flattened, with longer maturity Bonds offering only slightly higher yield than shorter term Bills. In high yield markets, credit spreads widened marginally but remained near historical lows.
Economic & Market Outlook
In just the few days after the end of the first quarter, the economic outlook has changed materially. The reciprocal tariff announcement was more forceful than many had expected, with some major trade partners now facing 15 – 49% tariff rates. If enacted as implemented, the effective tariff rate on U.S. imports may be on pace to exceed 20%, a level last seen around the imposition of Smoot-Hawley. As a result, the economic impact of tariffs proposed so far this year has risen to ~2% of U.S. GDP. The risk of recession has risen accordingly, though considerable uncertainty remains regarding potential challenges in courts and/or reactions from trade partners. In addition, the contours of the reconciliation bill in Congress are starting to take shape, which may be rushed along to provide offsets to consumers and businesses.
Declines in U.S. stocks have meaningfully reduced valuations for some pockets of the market. U.S. large cap growth has gone from 94th percentile valuations to 58th (based on normalized earnings, dividend yield and book value) since the beginning of the year as market concentration excesses have been unwound. Other portions of the market are starting to price at discount valuations: large cap value (46th percentile), large cap equal-weighted (31st percentile), small cap (13th percentile), international developed equities (28th percentile).
1Asset classes are represented by the following: Large Cap (S&P 500), Small Cap (Russell 2000), Int’l Dev. (MSCI EAFE), Int’l EM (MSCI EM), Real Estate (FTSE EPRA/NAREIT Developed), Core Bonds (Bloomberg U.S. Aggregate), Muni Bonds (Bloomberg Municipal), 60/40 Portfolio (60% MSCI ACWI, 40% Bloomberg U.S. Aggregate). Past performance may not be indicative of future results. One cannot invest directly in an index.