Market Snapshot: Tariffs and Tantrums and Trade, Oh My!

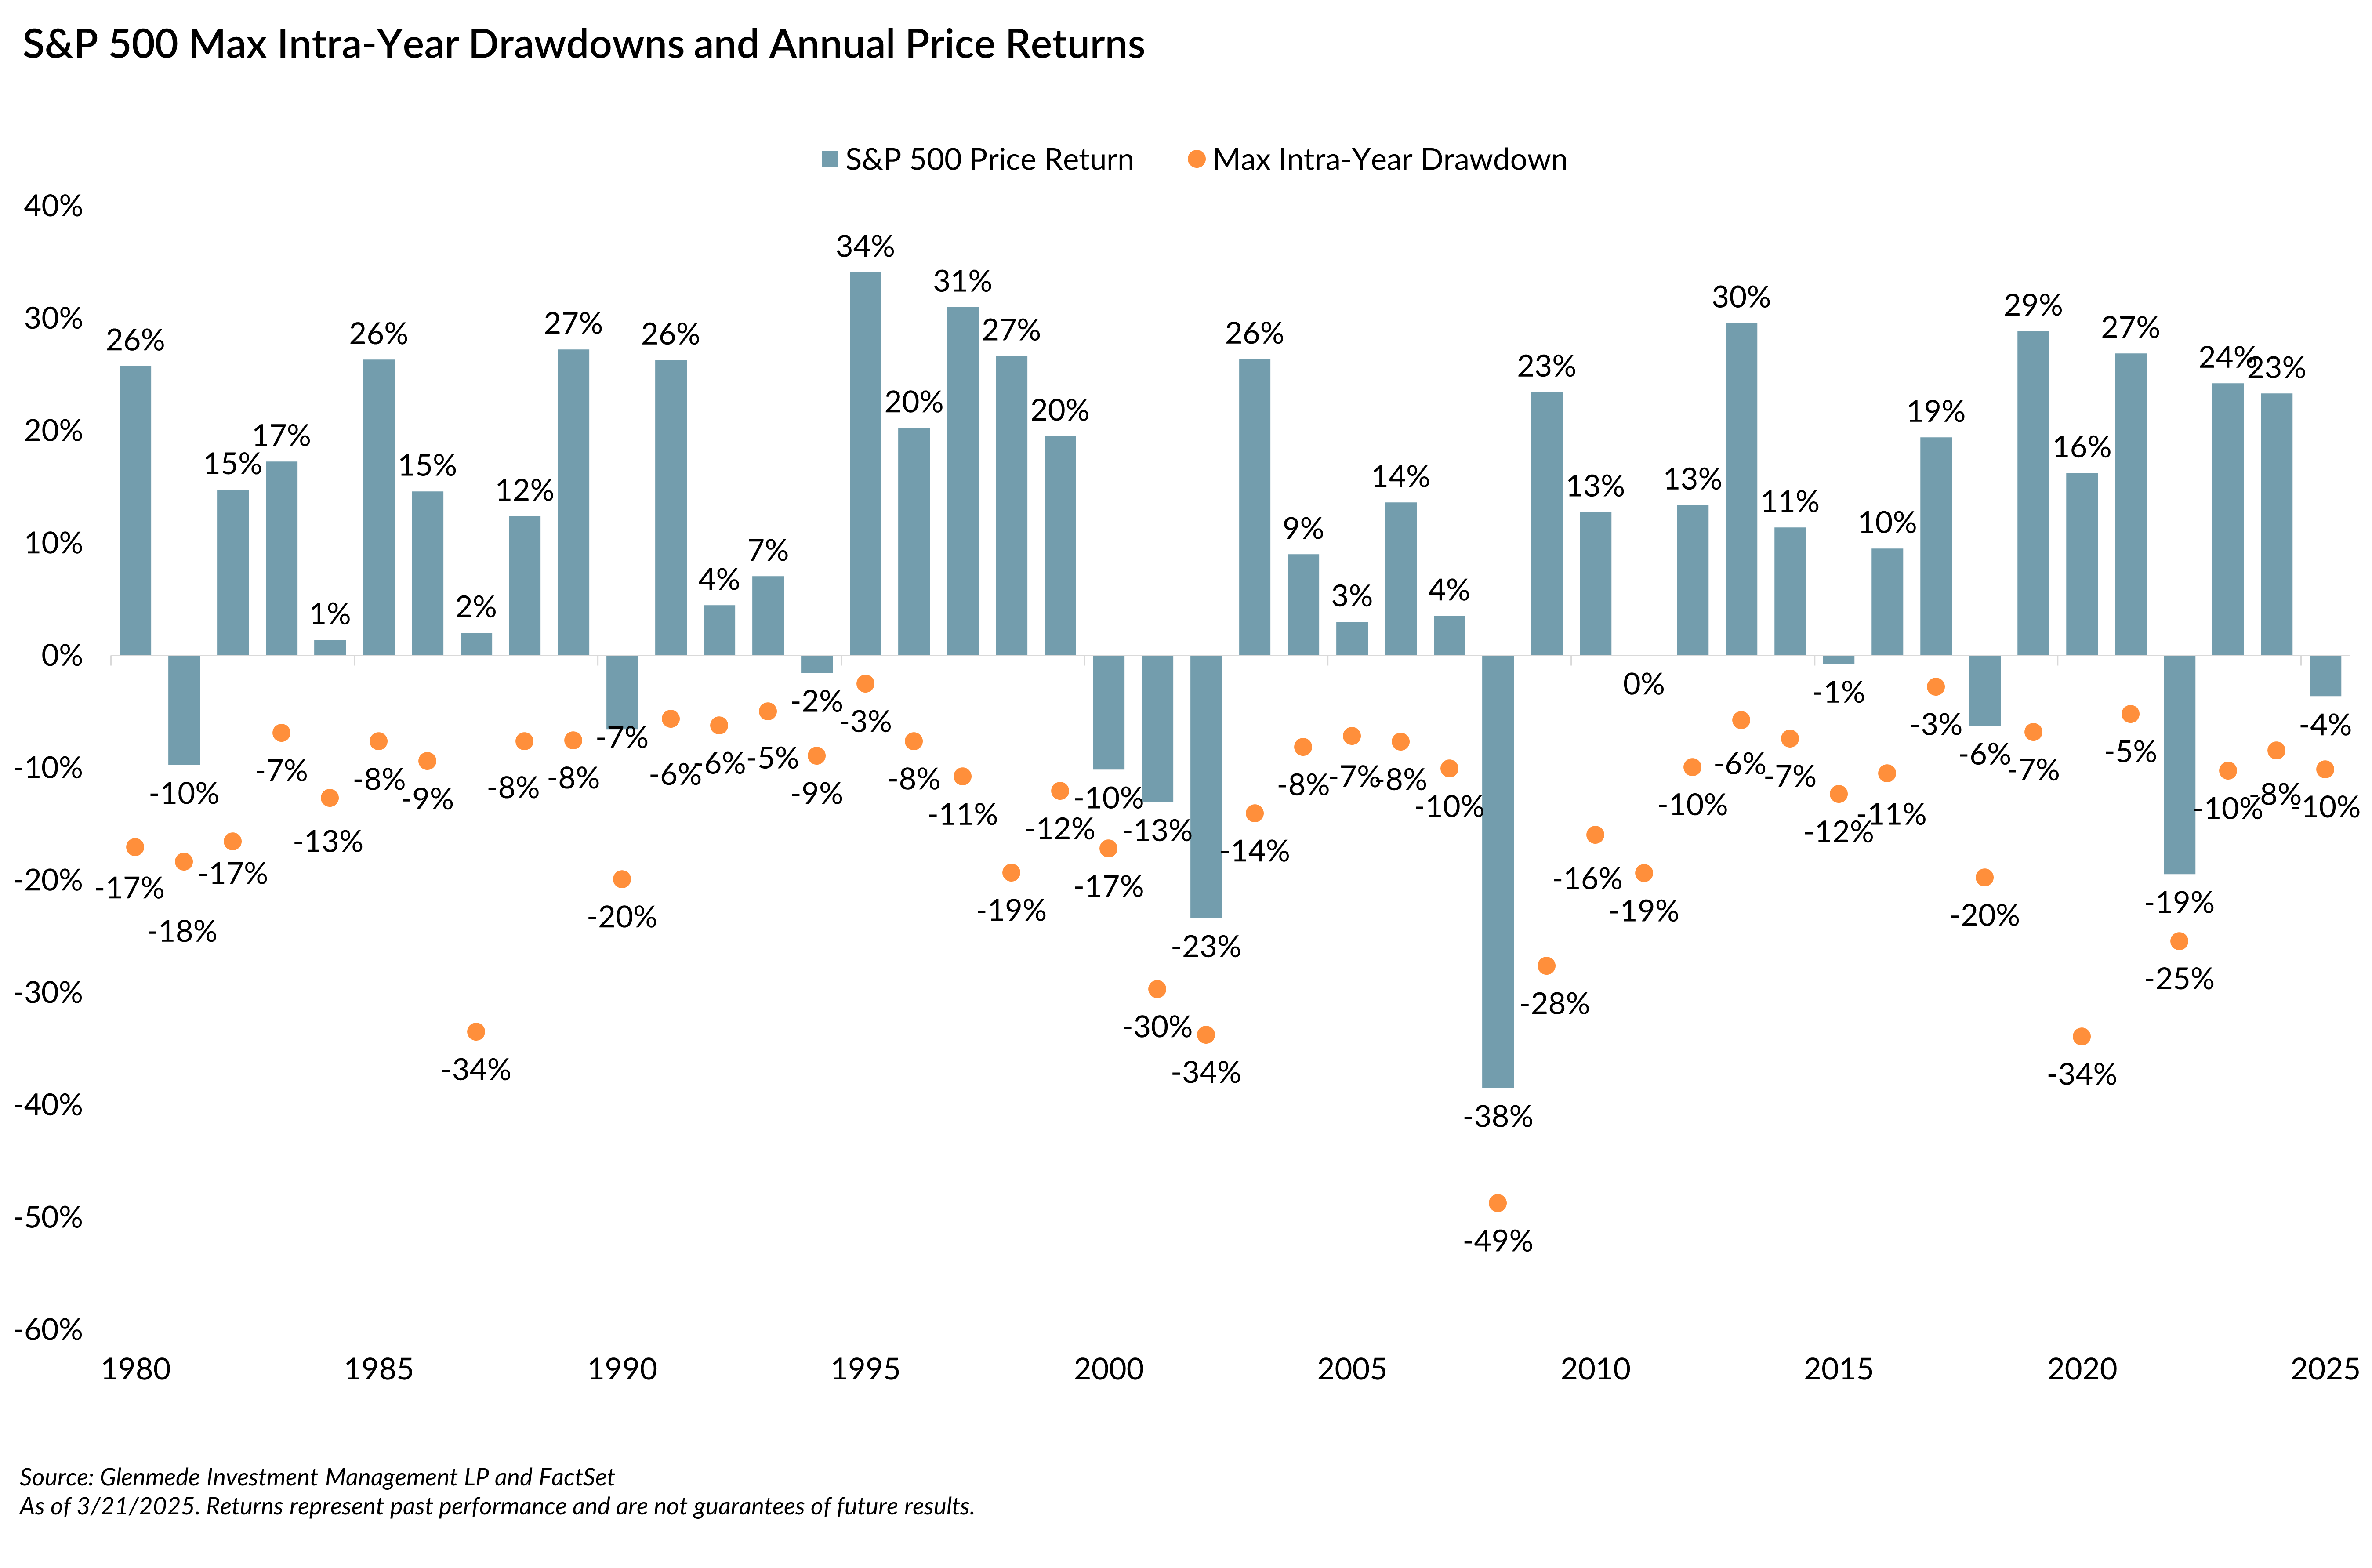
On March 13, 2025, the S&P 500 entered correction territory, closing ~10% lower than its all-time high. Since 1927, intra-year declines of 10% or more occurred in 57% of calendar years, a subset of which is shown in the chart. In comparison, declines of 20% or more consistent with a bear market were much less common, occurring in 20% of years over that same period. Market corrections are common, occurring on average 1-2 years amid shifting expectations and risk, but do not necessarily foreshadow an imminent bear market.
Uncertainty around trade policy has been a key catalyst, as several outstanding questions remain over the size and scope of tariffs to be implemented. The aggregate impact of all tariffs proposed so far on economic growth is in the ballpark of 1.5% of GDP, though the list seems to grow by the week. On their own, these tariffs are unlikely to lead to outright and persistent declines in GDP. However, it remains to be seen whether tariffs are the means to a negotiated end or an end in and of themselves, leading to a range of possibilities for their actual economic impact in 2025.
Globalization boosted corporate profit margins since the turn of the millennium due to wage savings and lower capital intensity, but changing trade dynamics may shift this tailwind to a headwind. Depending on the ability of companies to pass through higher costs to consumers, tariffs could shave 2.5-5% off the S&P 500’s 2025 earnings growth if all proposed levies are implemented as proposed. While tariff uncertainty is contributing to market jitters, the aggregate impact is more likely a moderation in growth for the economy and corporate earnings rather than an outright decline. We continue to believe that diversifying passive U.S. large cap exposure and adding to actively managed U.S. large cap or U.S. small cap is attractive.
Sources: Glenmede Investment Management LP and FactSet
All data as of 3/13/2025, unless otherwise noted. This represents past performance which is not indicative of future results. Securities mentioned are for informational purposes only and do not represent a recommendation or an offer to buy, hold or sell any securities, or all of the securities held in client portfolios. As with all investments, loss is possible. See Additional Disclosures at the end of this document.
For institutional/professional investors only.