Market Snapshot: 2024 Election Volatility Elevated
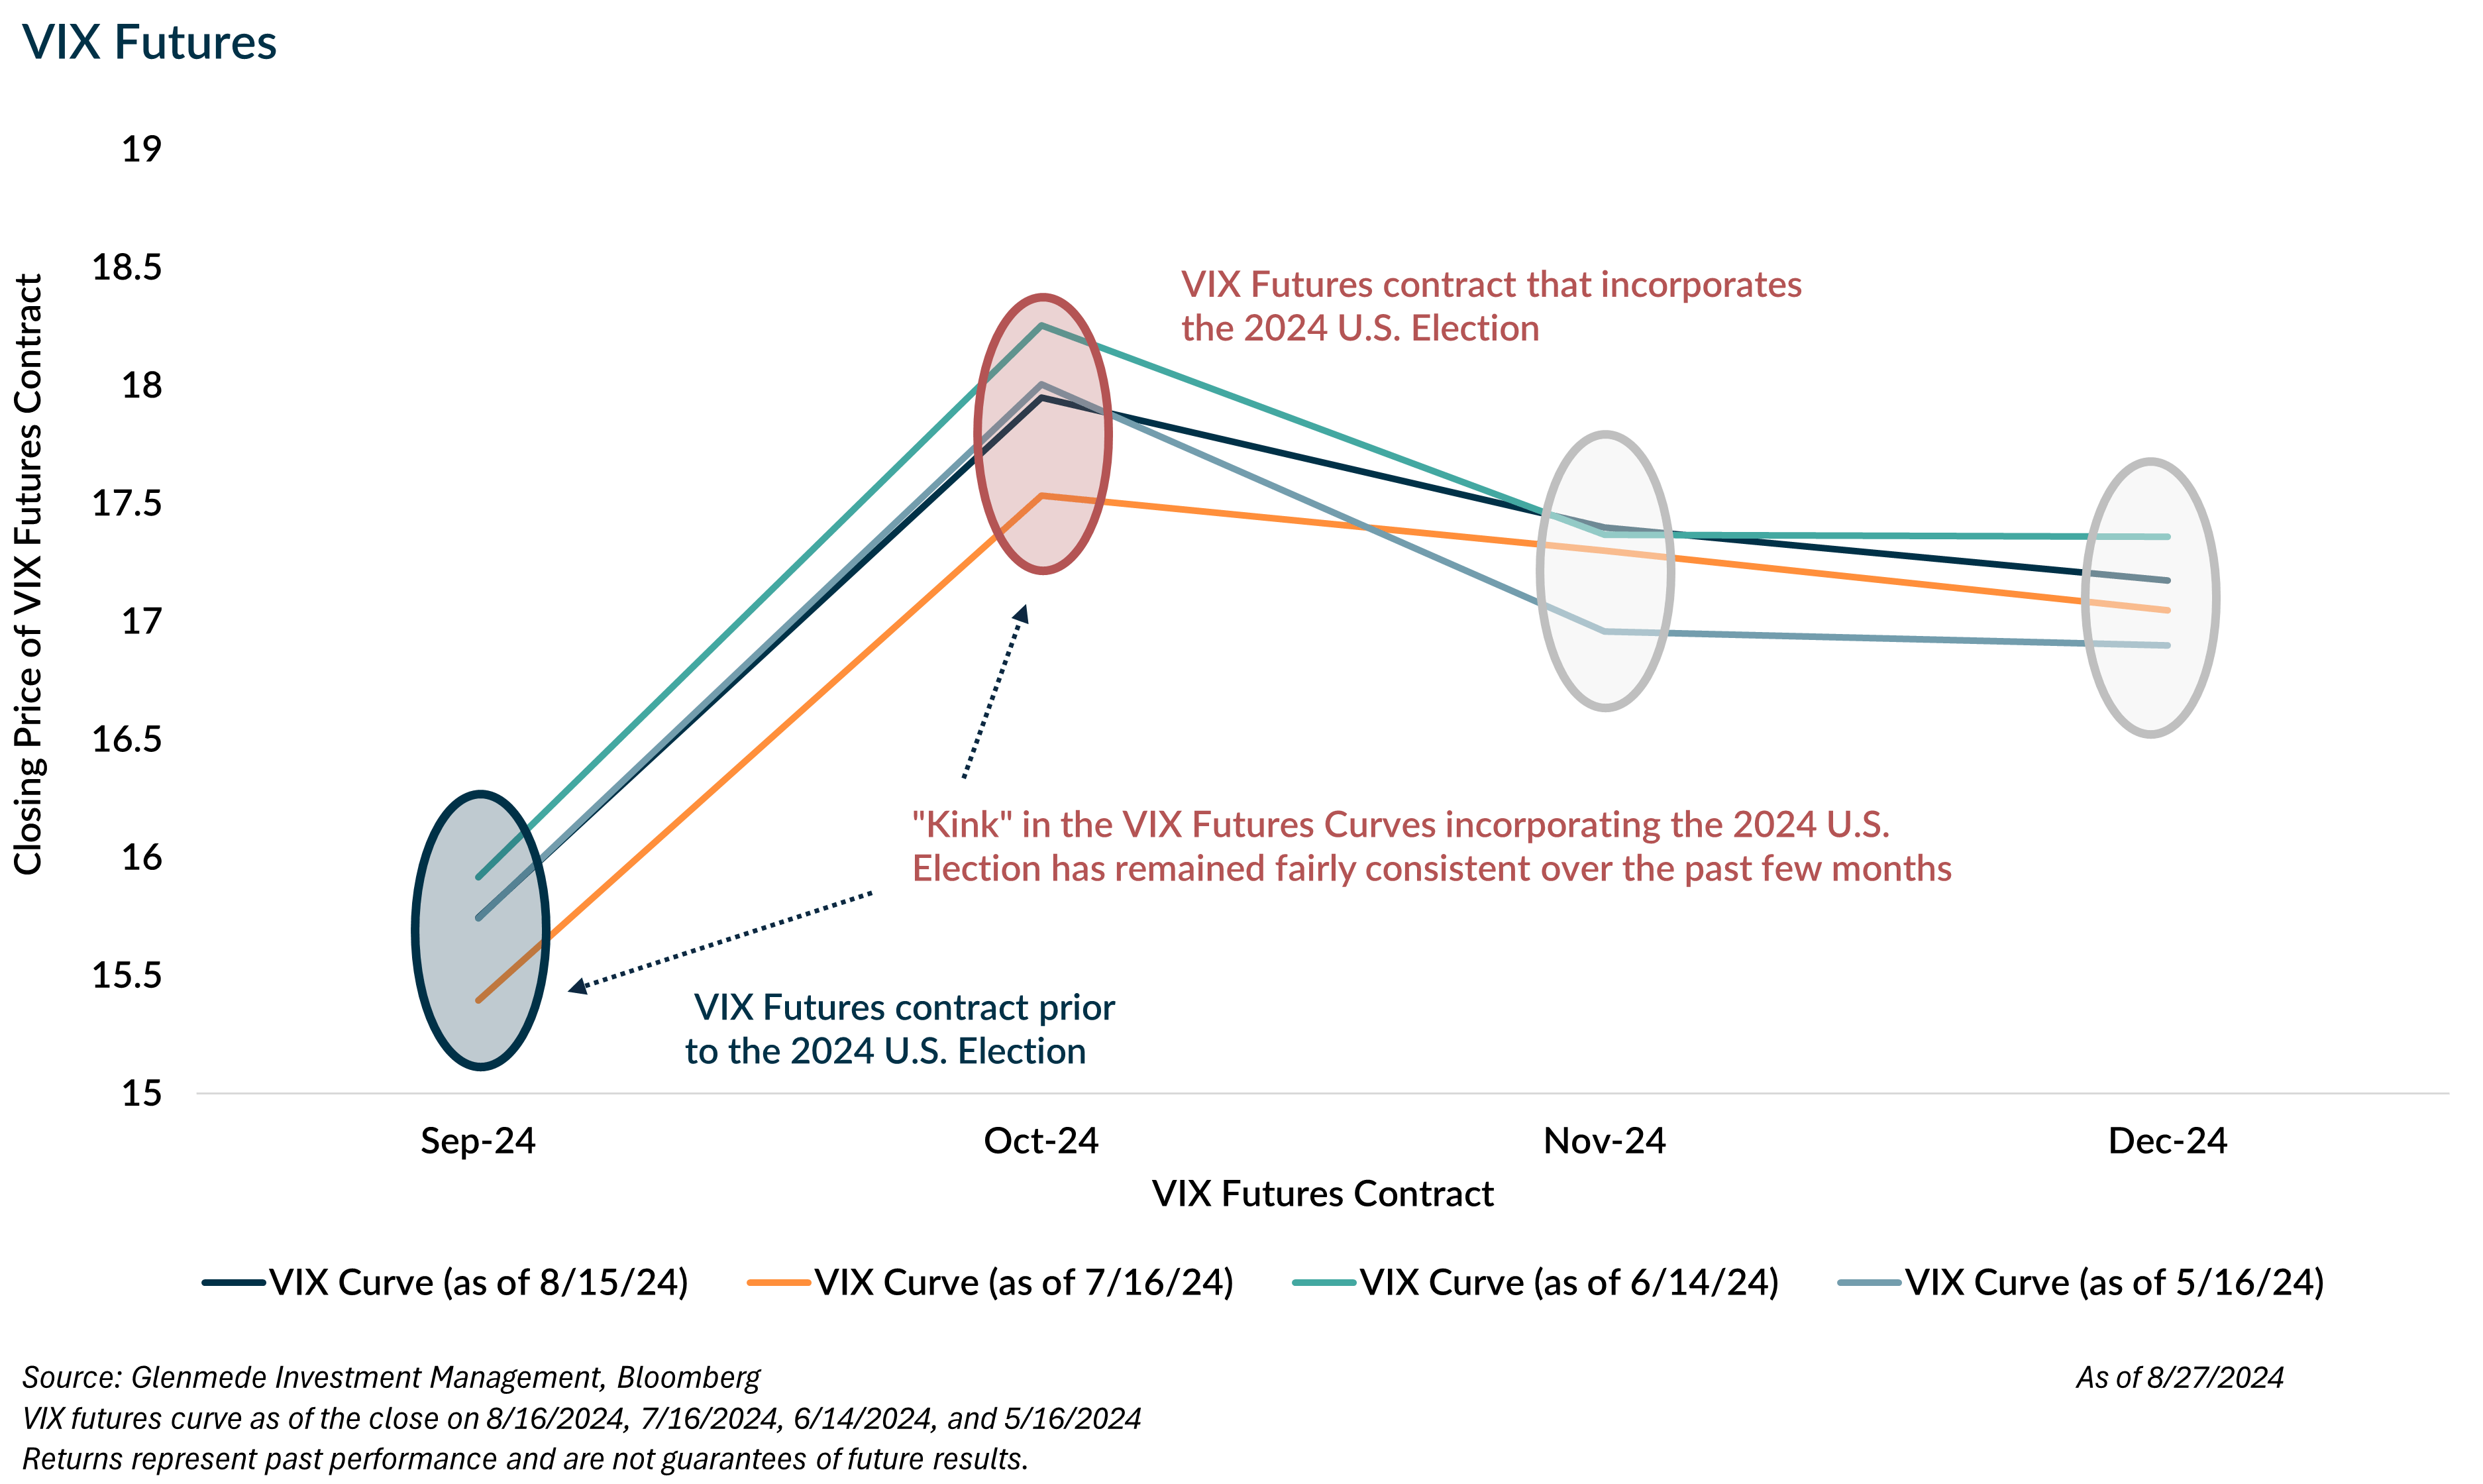
While candidates have changed and polls have varied, the expectation for “election volatility” has remained consistent over the past few months. Specifically, the CBOE Volatility Index (VIX)1 futures curve2 has a “kink” in the curve around the election. The chart below looks at the closing VIX futures curves in one month increments over the past four months3, and clearly shows an increase in expected volatility around the election and a normalization process post-election.
Relative to the elections of 2016 and 2020, the VIX curve is pricing in more “election volatility.” The VIX curve in 2016 at a similar time prior to the election4 reflected a traditional upward slope, suggesting limited election volatility expectations driven by the market’s (ultimately erroneous) perception of a low probability of a surprise outcome. At roughly the same time in 2020 the VIX curve displayed a “kink” with an expectation for election volatility, but more difficult to attribute to the election alone given the high volatility occurring during the Covid lockdowns.
While the U.S. elections could produce some short-lived volatility in November, they historically result in low dispersion of S&P 500 returns for longer term investors, regardless of the winning presidential party. Comparing U.S. elections since 1872, the most dispersion in returns occurs when one party has strong control versus a more divided government5. In other words, markets prefer some gridlock, however all scenarios averaged positive returns. While conversations may be plentiful over the next several months and markets may experience a few bumpy days around the election, we believe changes in economic assumptions, not volatility kinks, should drive asset allocation conversations for long term investors.
1 According to the cboe.com, the CBOE Volatility Index (VIX) “a financial benchmark designed to be an up-to-the-minute market estimate of expected volatility of the S&P 500 Index, and is calculated by using the midpoint of real-time S&P 500® Index (SPX) option bid/ask quotes. More specifically, the VIX Index is intended to provide an instantaneous measure of how much the market thinks the S&P 500 Index will fluctuate in the 30 days from the time of each tick of the VIX Index.”
2 The VIX future is a representation of market expectations for volatility of the S&P 500 for the 30 days forward from expiration (ex. VIX October future is the market’s expectations for S&P 500 volatility the 30-days after October expiration (10/16/2024)).
3 VIX futures curve as of the close on 8/16/2024, 7/16/2024, 6/14/2024, and 5/16/2024.
4 Snapshots of the VIX curve in 2016 and 2020 were the closing prices on 8/18/2016 and 8/20/2020, respectively, to maintain consistency with the 2024 snapshot which was two days prior to options expiration.
5 Compares total returns for the S&P 500, adjusted for inflation for each four-year presidential election cycle since 1872. Returns for the S&P 500 are backfilled with estimated returns for the S&P composite based on data provided by Robert Shiller prior to 1970.
All data is as of August 27, 2024, unless otherwise noted. Opinions represent those of Glenmede Investment Management LP (GIM) as of the date of this report and are for general informational purposes only. This document is intended for sophisticated, institutional investors only and is not intended to predict or guarantee the future performance of any individual security, market sector or the markets generally. GIM’s opinions may change at any time without notice to you.
Any opinions, expectations or projections expressed herein are based on information available at the time of publication and may change thereafter, and actual future developments or outcomes (including performance) may differ materially from any opinions, expectations or projections expressed herein due to various risks and uncertainties. Information obtained from third parties, including any source identified herein, is assumed to be reliable, but accuracy cannot be assured. This paper represents the view of its authors as of the date it was produced and may change without notice. There can be no assurance that the same factors would result in the same decisions being made in the future. In addition, the views are not intended as a recommendation of any security, sector or product. Returns reported represent past performance and are not indicative of future results. Actual performance may be lower or higher than the performance set forth above.